Comparing Top or Bottom N Categories
This module will walk you through writing a text insight comparing a set number of categorical values. You can use these techniques to write about the best or worst performers in a dashboard. In this example, we'll be writing this sentence:
A is the riskiest state with $B in loans that are more than 90 days overdue. It is followed by C ($D) and E ($F).
Things to keep in mind while working through this module
- What if multiple categories have the same value?
- Are higher values in your data "better" (e.g. revenues, profits, increases in stock prices, etc.) or lower values (e.g. churn rates, crime rates, opioid-related deaths, etc.)?
- What happens if there are fewer categories than the top or bottom number we set?
Calculations
Calculations are how you transform the data table coming from the Tableau dashboard into relevant data table you can write about. The columns in the data table you save after performing a calculation become Data Variables that you'll write about in your Template.
For this insight, we are interested in writing about the three states with the highest amount of loans that are more than 90 days overdue. So the calculations we need are the top 3 states and the loan amounts for those states. Use the Hidden Sheet Full worksheet for these calculations. This worksheet is not filtered as our audience selects things on the dashboard and will always include the full summary data. It was built to just use in Wordsmith and does not correspond to one of the visualizations in the dashboard. For more information on why and how this worksheet was created, check out our guide on Using Worksheets in Wordsmith.
Step 1: Filter
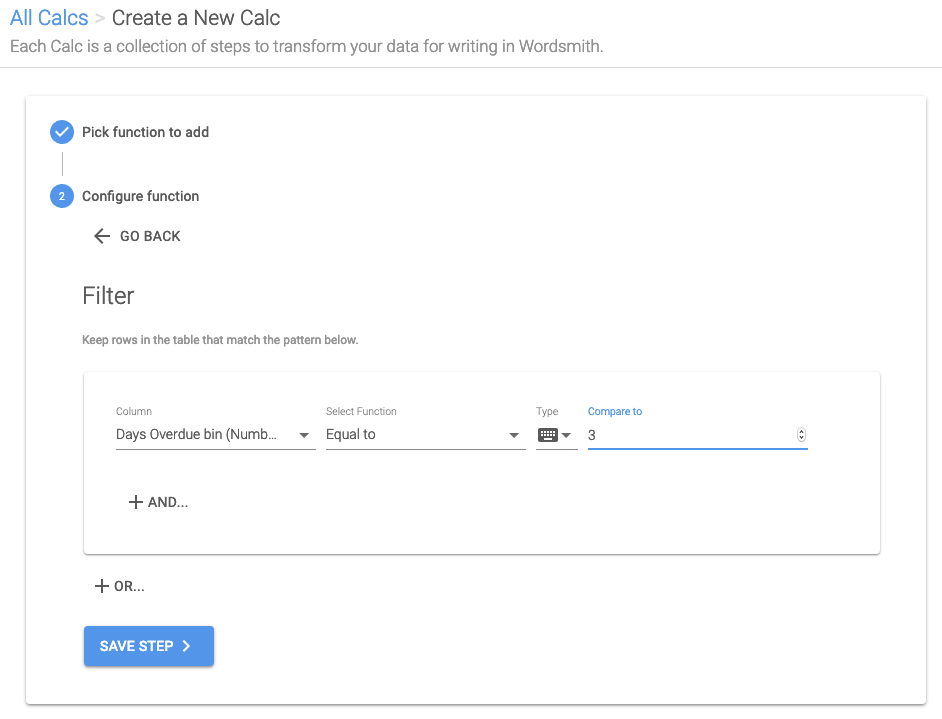
For the first step, we want to filter down to loans that are overdue by 90 days or more. In our column "Days Overdue Bin" - "1" is equal to 30 days overdue, "2" is equal to 60 days overdue, and "3" is equal to 90 days overdue.
What you'll want to do is to filter the table to only include data when the "Days Overdue Bin" column is equal to a value of "3". This will give us a data table with loans that are at least 90-days overdue.
Step 2: Group
Next, we'll group by the "state" column and Aggregate the "sum amount" column by adding up all the values. Let's also aggregate a second column in case there is a tie in the first column. So Aggregate the "sum days overdue" column by adding up all the values This will give us a data table with each state, it's 90-day loan amount, and sum of days overdue.
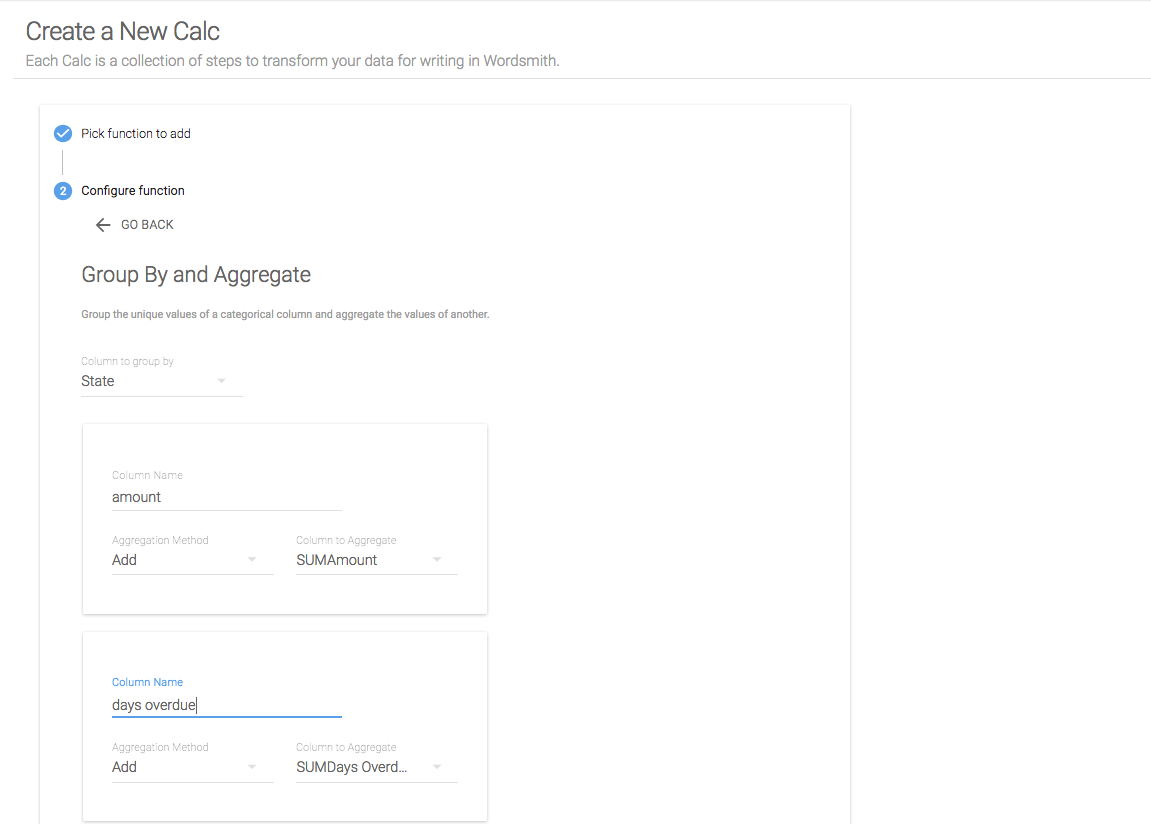
Aggregating a secondary column is giving us another column to sort by in case multiple states have the same loan amount.
Step 3: Sort
We only want to keep the states with the most 90-day loans, so we want to Sort this table by the amount column in descending order. We'll add a secondary sort for the days overdue column. This will give us a data table with the top states by 90-day loans in the top rows of the table, and if there are any states with the same amount, the states with the highest days overdue will be first.
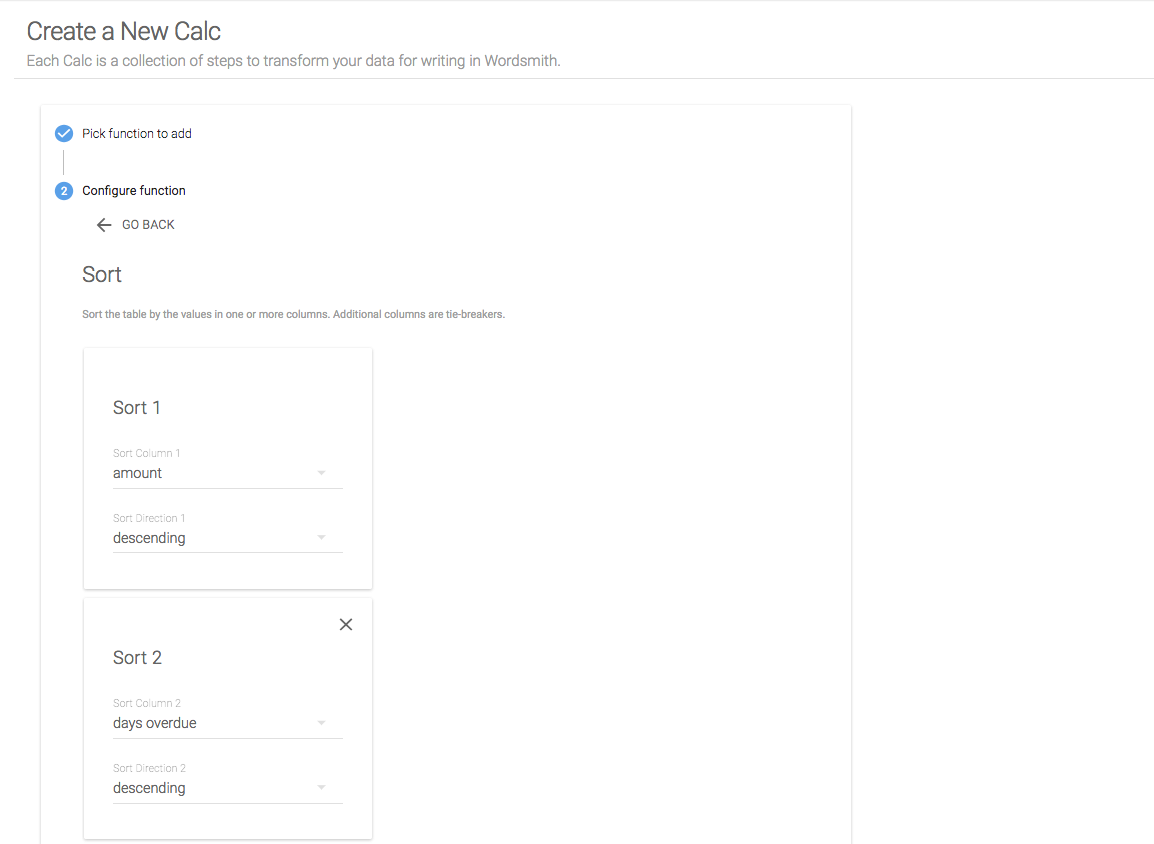
Choose the sort direction depending on if you want the highest values or the lowest values in your data table.
Step 4: Select
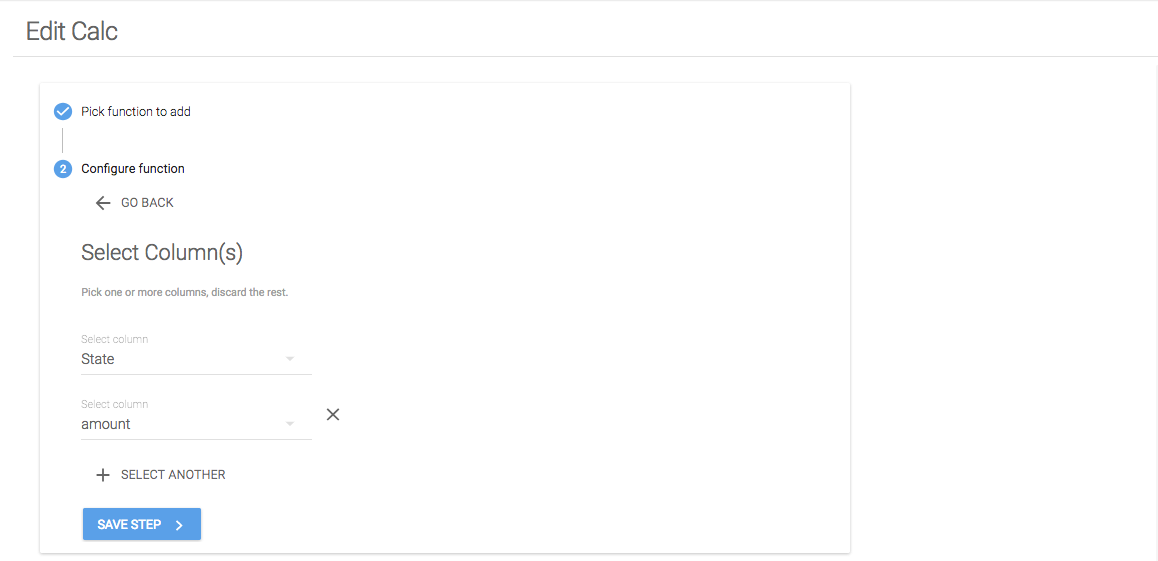
We only needed the "sum days overdue" column in case there were multiple states with the same value for "amount". So let's just keep the columns we need in our narrative by Selecting the "state" column and the "amount" column.
Step 5: Nth
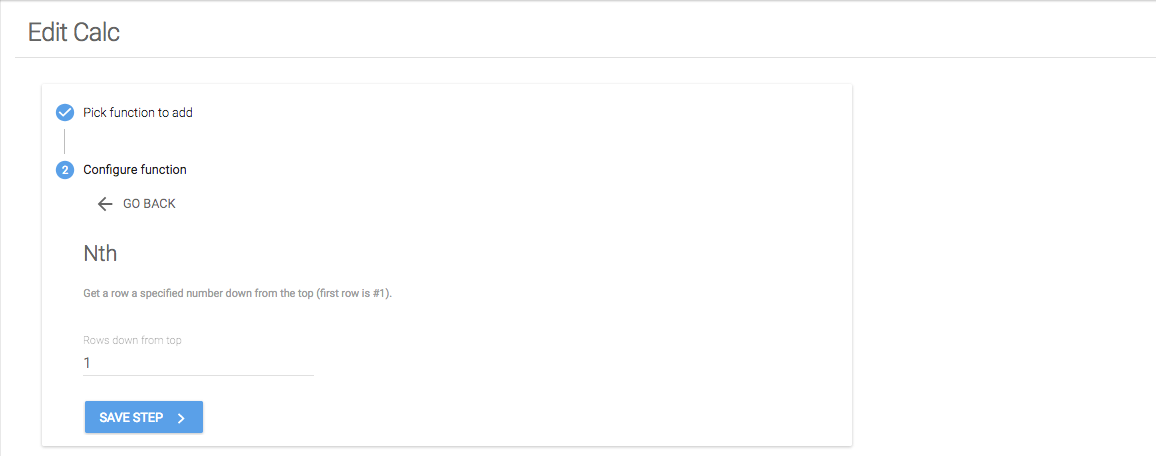
Because we just want to write about the top three states, we'll start by creating a Calc for the top state by using the Nth function and setting it equal to 1. This will give us a table with just the top state by 90-day loan amount.
Save Calc
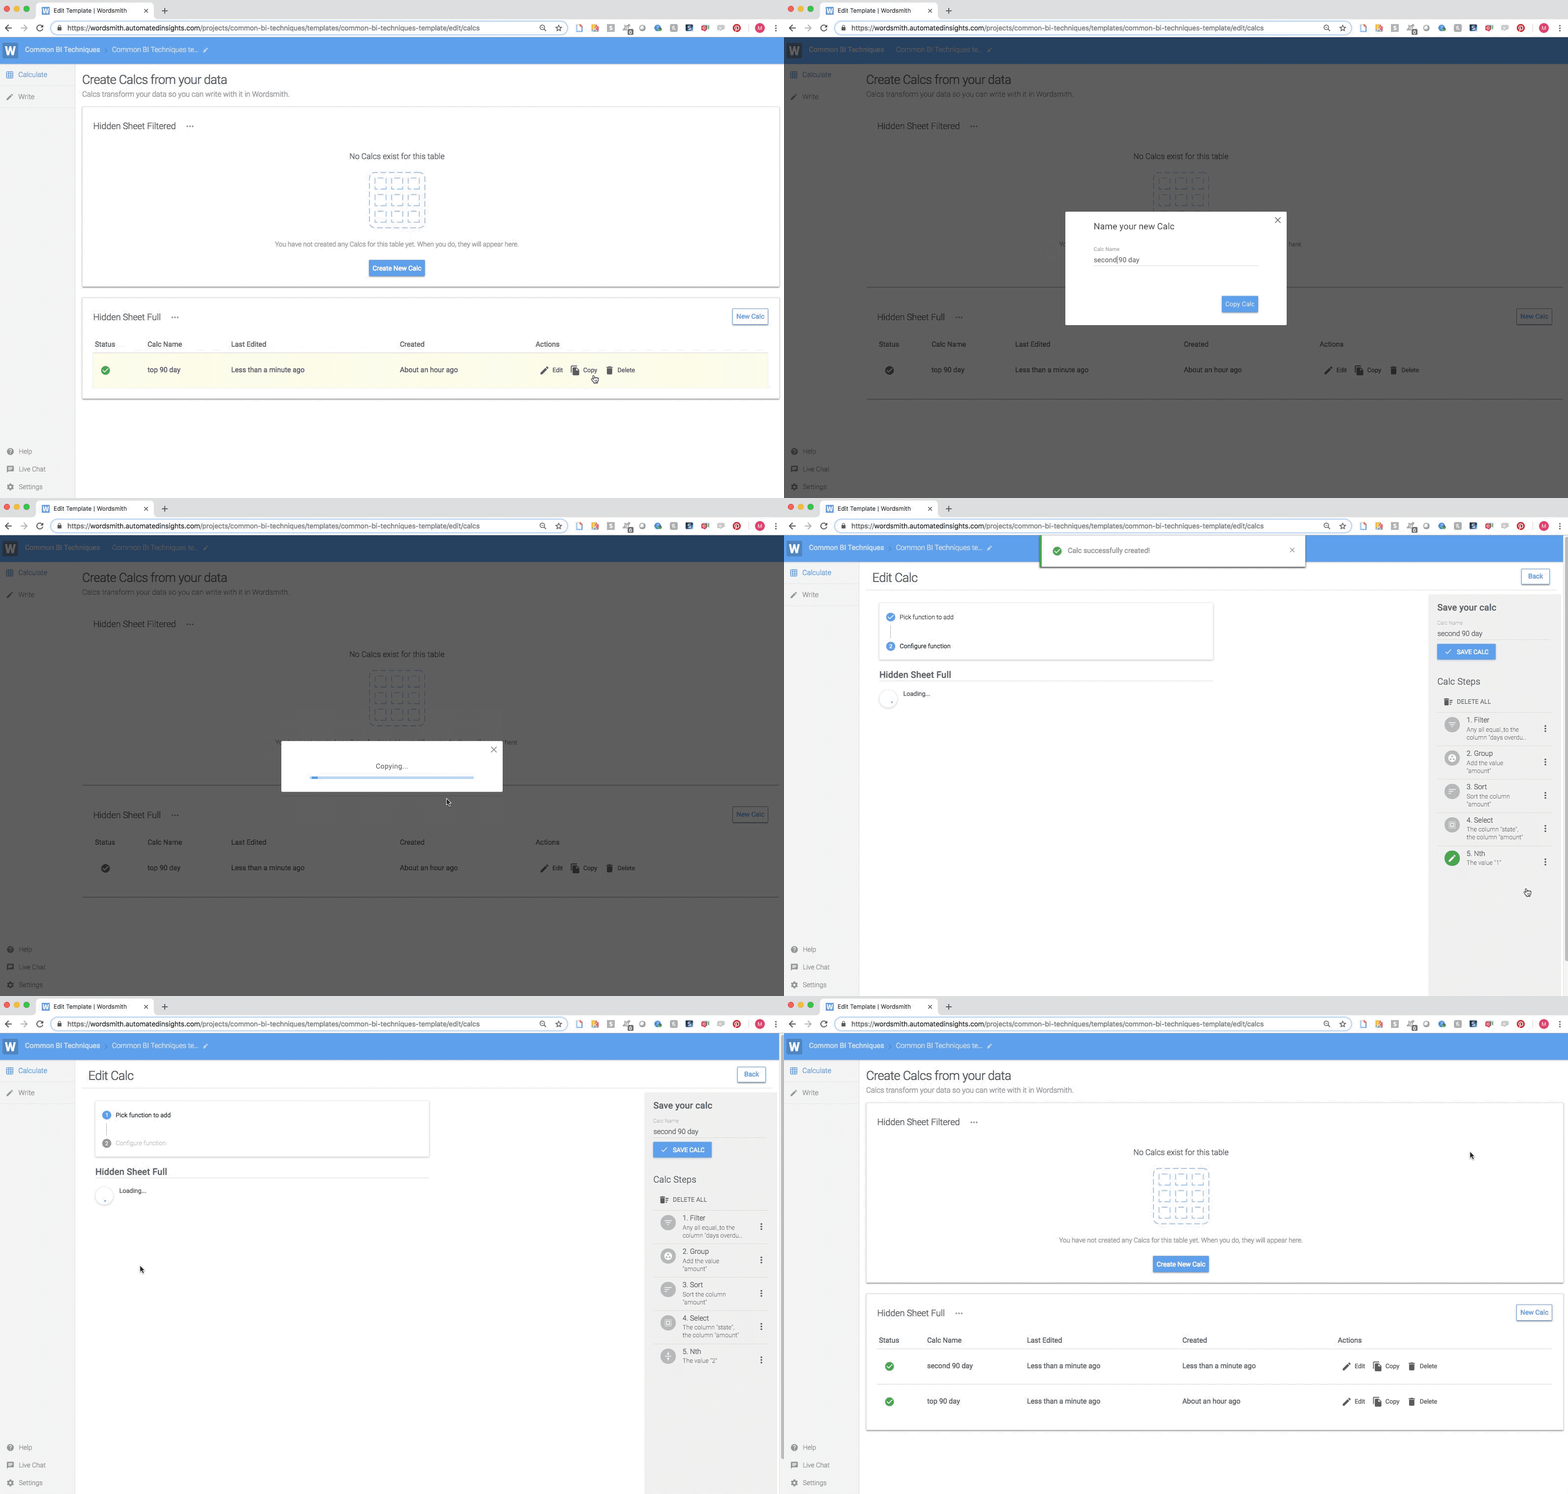
If we save this Calculation, we'll have two Data Variables to use in our Template for the top state: state name and 90-day loan amount for the top state. We'll repeat these steps to get a Calculation for the second and third highest states. We can save some time by copying the calc, and editing the last step. For the second highest calc, Nth should be set to 2, and for the third highest state, Nth should be set to 3.
Template
The columns in the data tables saved after performing Calculations are Data Variables in the Template. A Template is how insights are automated. It's a rules-based hierarchy that allows you to change the text based on the data in the dashboard.
Now that we have the Data Variables we need from the Calculations we wrote, we'll use them in a Template. First, we'll insert those Data Variables.
Inserting Data
Data Variables have a data type, which determines the formatting options and operators available in Branches. A Data Variable is like a placeholder for data in the Template that will be determined by the underlying data in the dashboard.
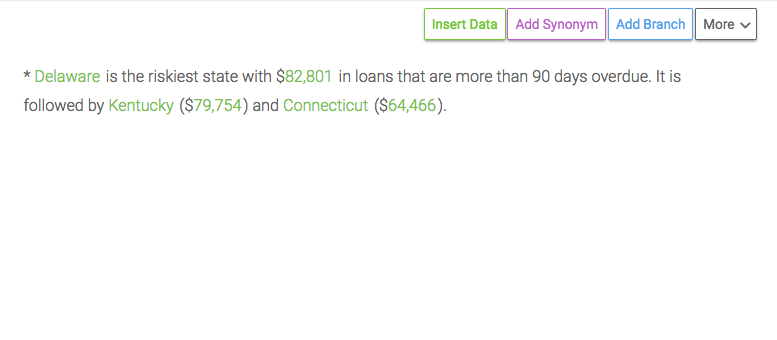
In this example, the top, second, and third states are text Data Variables and the the top, second, and third amounts are number Data Variables. We'll start by writing the sentence in our Template and inserting the Data Variables for the top states and their amounts.
Adding Branches
Branches are if/then/else statements that change the text in the narrative based on the data. To write a Branch, write rules using the Data Variables in the Template. If those rules are true, decide what text should be written in the narrative. Branch rules are evaluated according to the Waterfall Method - one at a time from the top-down. But you can customize how many rules in the Branch are written.
We'll add a Branch to the Template so that if there are states with the same loan amount, we'll acknowledge it. We'll start by selecting the whole sentence and adding a Branch for it. Then we'll write rules for the different scenarios in which we want the text to change.
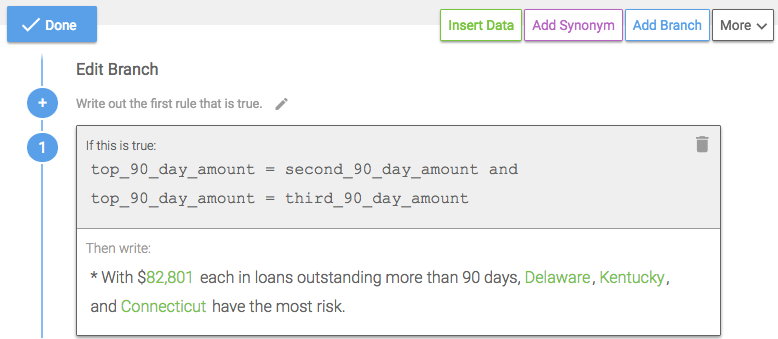
Rule 1: If all three states have the same loan amount
We'll use the loan amount for each state in the logic for this rule. We want to check to see if the top state has the same loan amount as the second state and the third state. If it does, then we'll write a specific sentence calling that out.
Rule 2: If the top state and second state have the same loan amount
All the states may not have the same loan amount, but different combinations of states could have the same amount. Like the top state and the second state, for example.

Rule 3: If the second and third states have the same loan amount

Default Rule
By selecting "Add text if no rules are true", you can create a default rule. This text is written if none of the rules in the Branch are true. In this example, if none of the rules in our Branch are true, then we know that each state has a unique loan amount and we can write the original sentence we started with.

By adding these rules to a Branch, we've accounted for a scenario where multiple states have the same loan amount.
Nested Branches
Branches can be nested inside each other for more complicated or multi-step logic. The Template is like a decision tree, and any time the text should change based on the data, write a Branch.
To account for a scenario where we may not have three states at the top, let's put a Branch around the Branch we just wrote.
Rule 1: The third state is not null
If the third state is not null, then we know we have a value for it. And if we have a value for the third state, then we must have a value for the top and second states, as well. So we'll write about all three by going directly into the first Branch we wrote which will customize the text if any of the loan amounts are the same for the states.
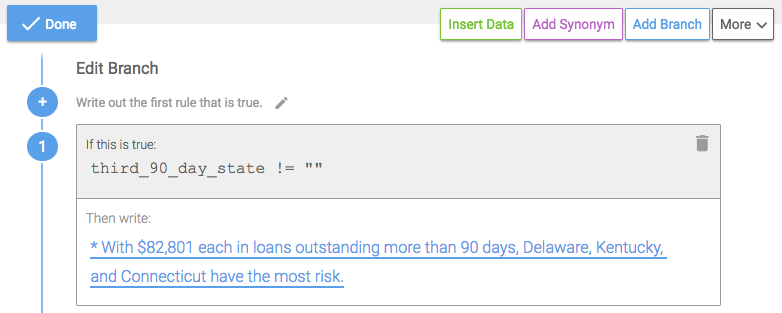
Rule 2: The second state is not null
If the we get to the second rule in the Branch, then we know the first rule has to be false. So if the second rule is true (that we have a value for the second state), then we must just have a value for the top and second states, but not the third state.

We can also add a Branch in this rule to change the text if the loan amounts for the top state and second state are the same.
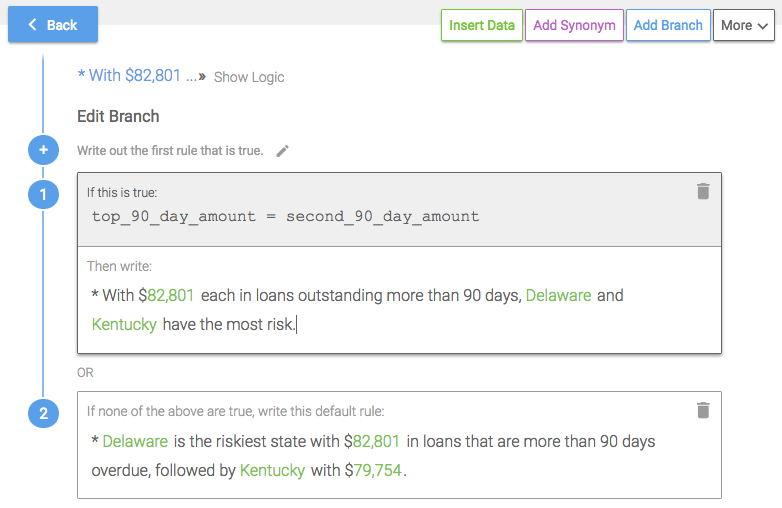
Default Rule
The only other option if rule 1 and rule 2 are false is that in the current data, we only have a value for the top state. So we'll just write about that one state in our narrative.

By checking for null values in this Branch, we've accounted for the scenario where there are fewer categories than what we set.
Dashboard
Now that we've written the Calcs we needed to transform the underlying data and the Template to change the narrative as the data changes, we can pull our insight into the Tableau dashboard. To do that, select "Refresh Narrative" in the top right corner of the Wordsmith extension. This will pull in any changes you've made to the Calcs and Template.
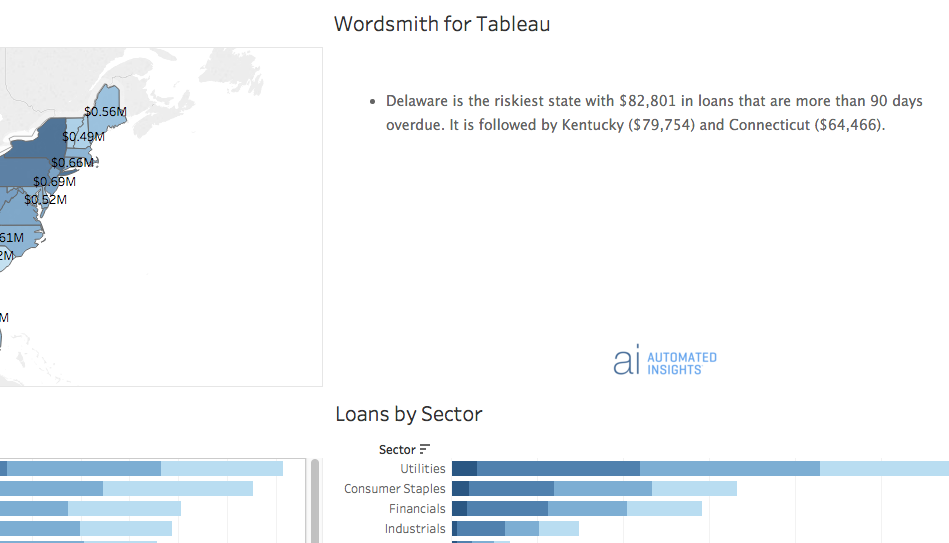
Check out the next module to write an insight for all categories meeting a threshold.
Updated almost 7 years ago
