Wordsmith Features
There are a few features in the Wordsmith Template Editor that you'll want to get familiar with. You'll see them at the top right of the Write tab in your Wordsmith account.
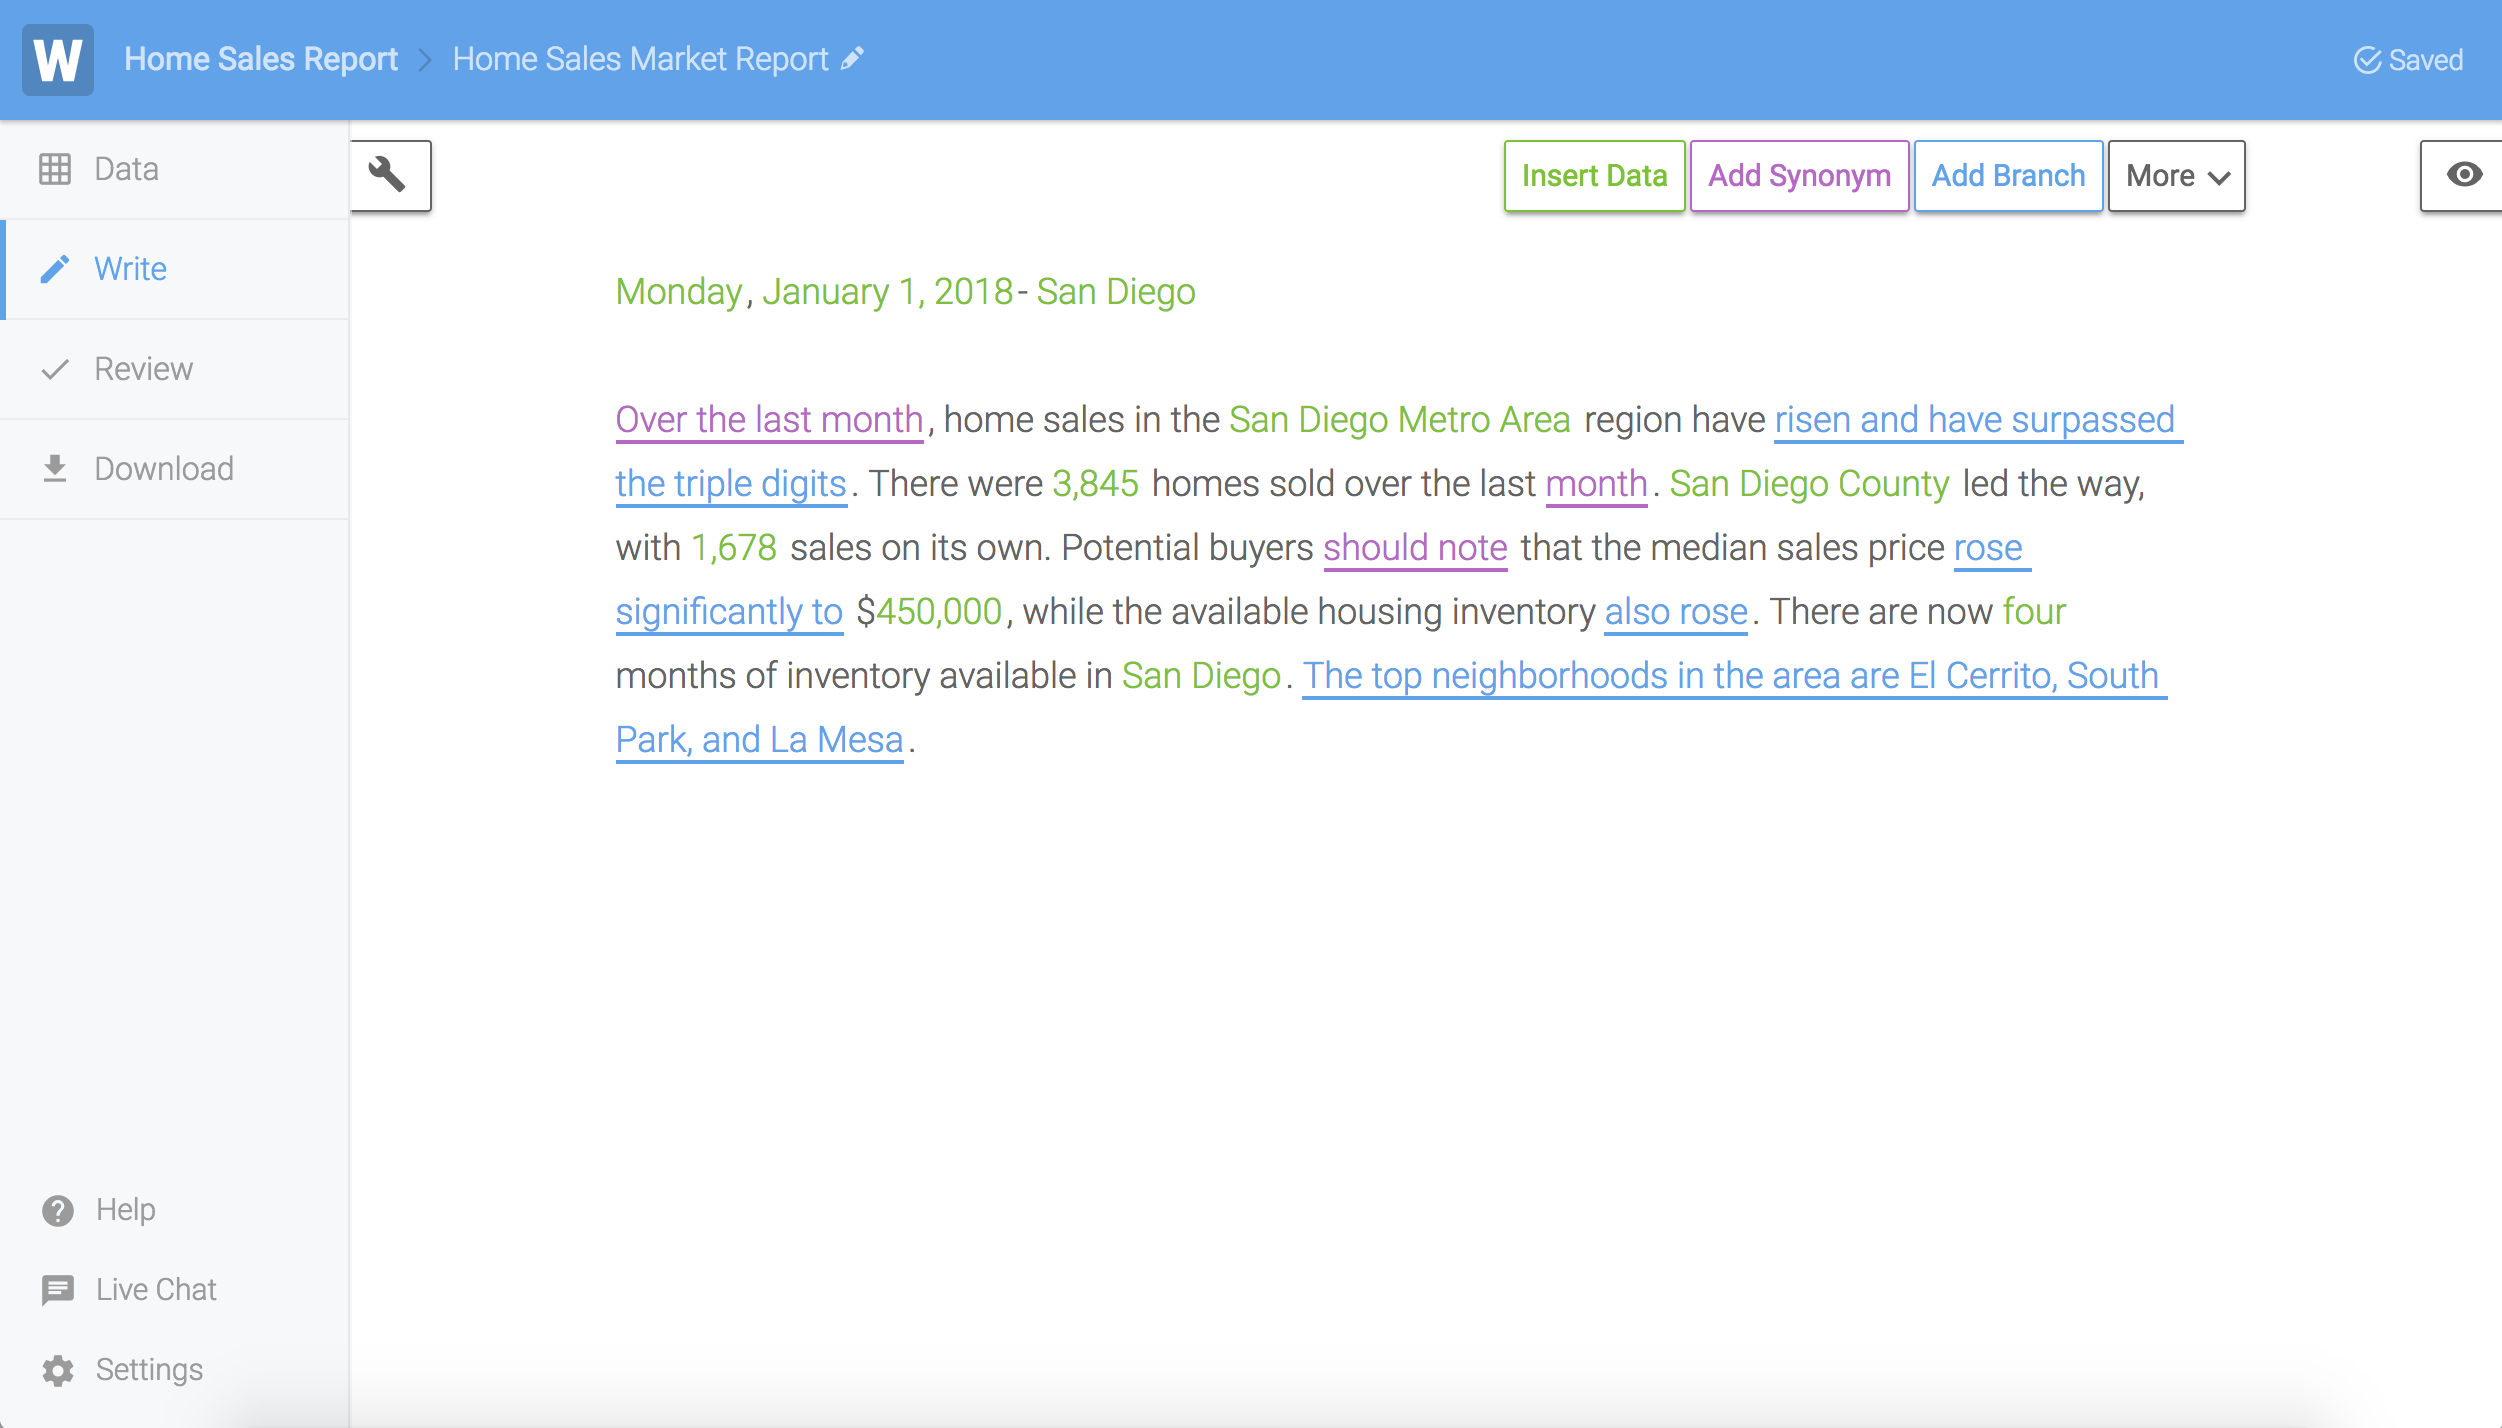
Insert Data
The column headers of the spreadsheet you upload to your Wordsmith Project are the Data Variables you can reference throughout your Template. These Data Variables are dynamic placeholders for your data. You'll see a drop-down list of all Data Variables when you click on the "Insert Data" button. And next to each Data Variable is an image corresponding to the type of data it is: Number, Text, List, Date, True/False, Time, or DateTime.
Pro Tip: this list is searchable.
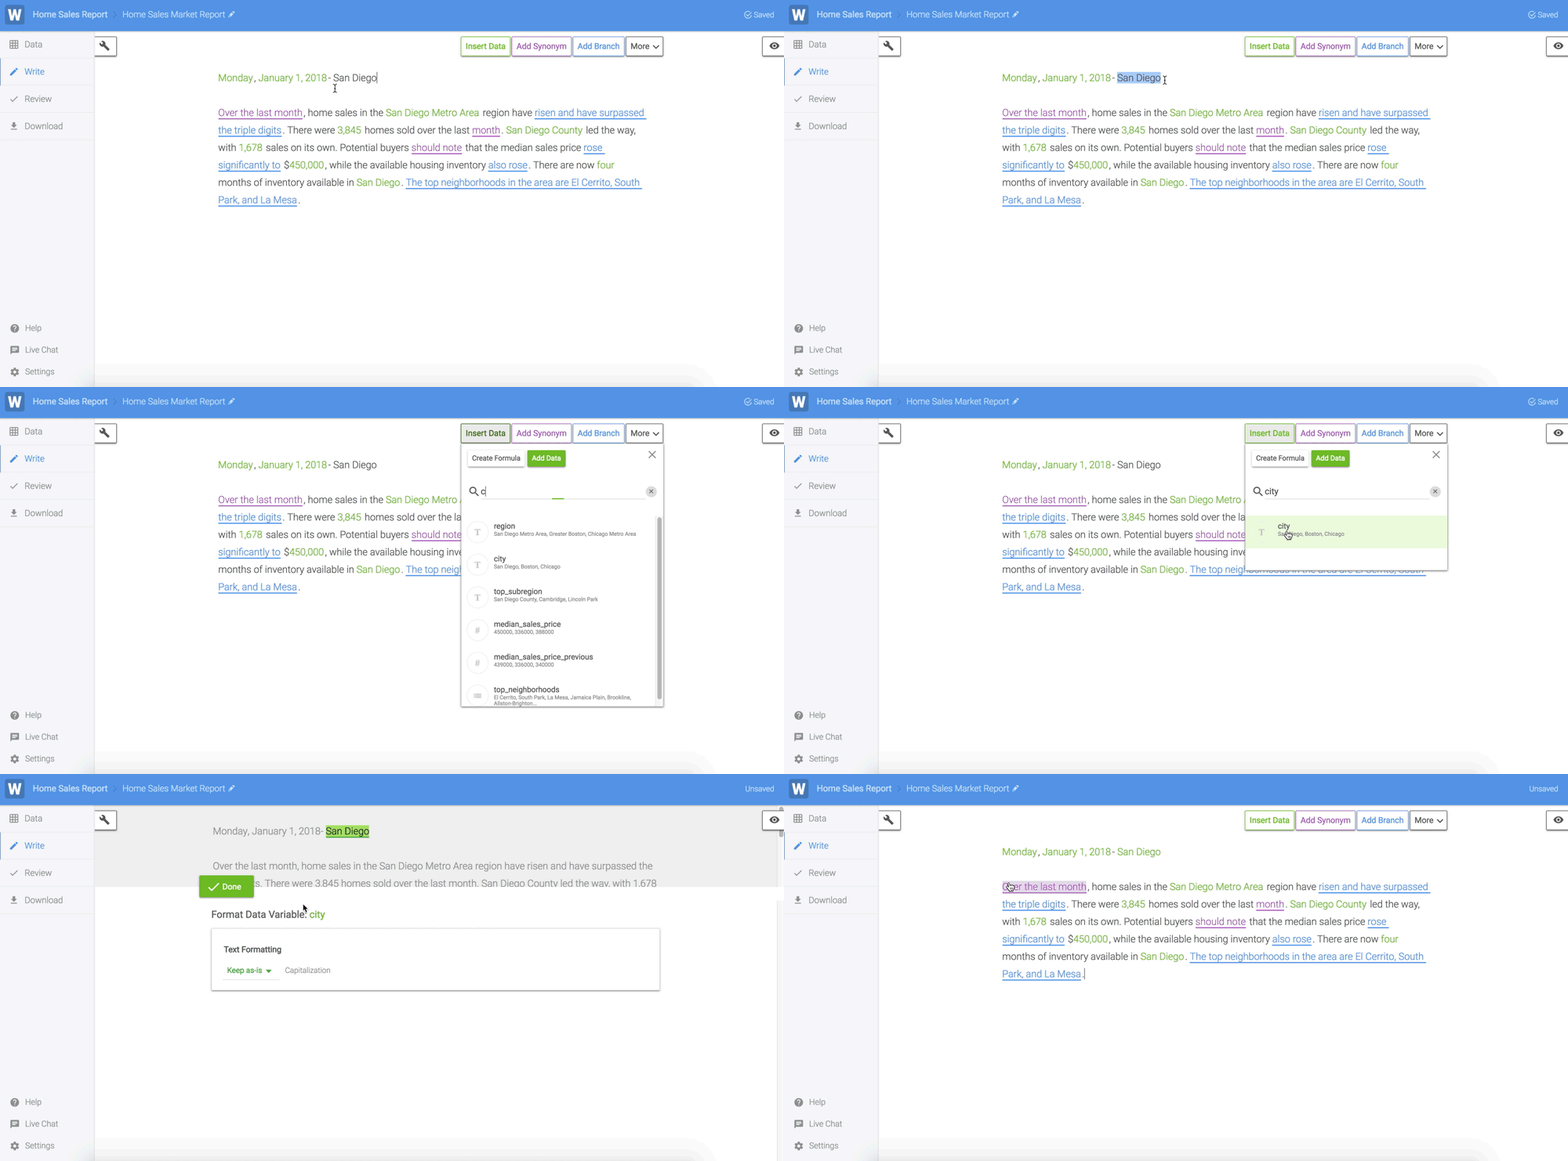
You will also use your Data Variables in the conditional logic that's included in your Branches.
Add Synonym
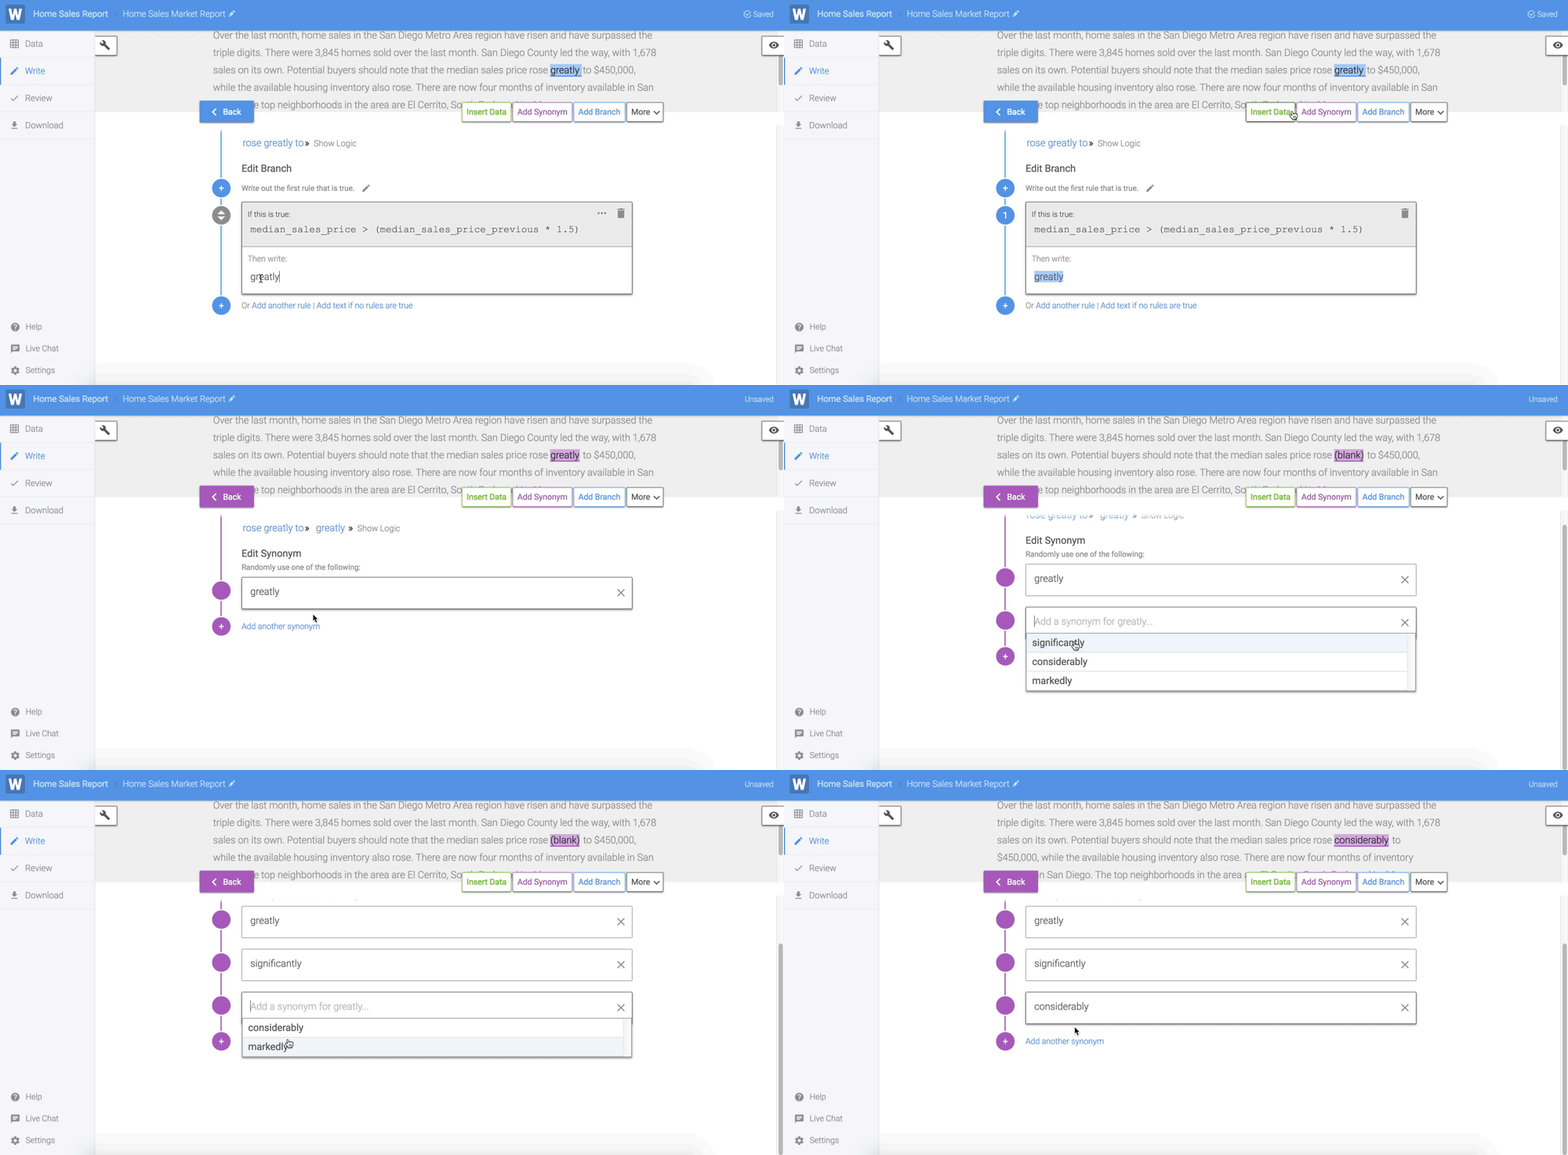
You can write synonymous words, phrases, sentences, and even whole paragraphs throughout your Template. One of the options you write will be selected randomly when your narrative is created. Wordsmith will even try to help you come up with Synonyms by suggesting some options for you.
Pro Tip: click the Tab key on your keyboard to add a new Synonym option.
Add Branch
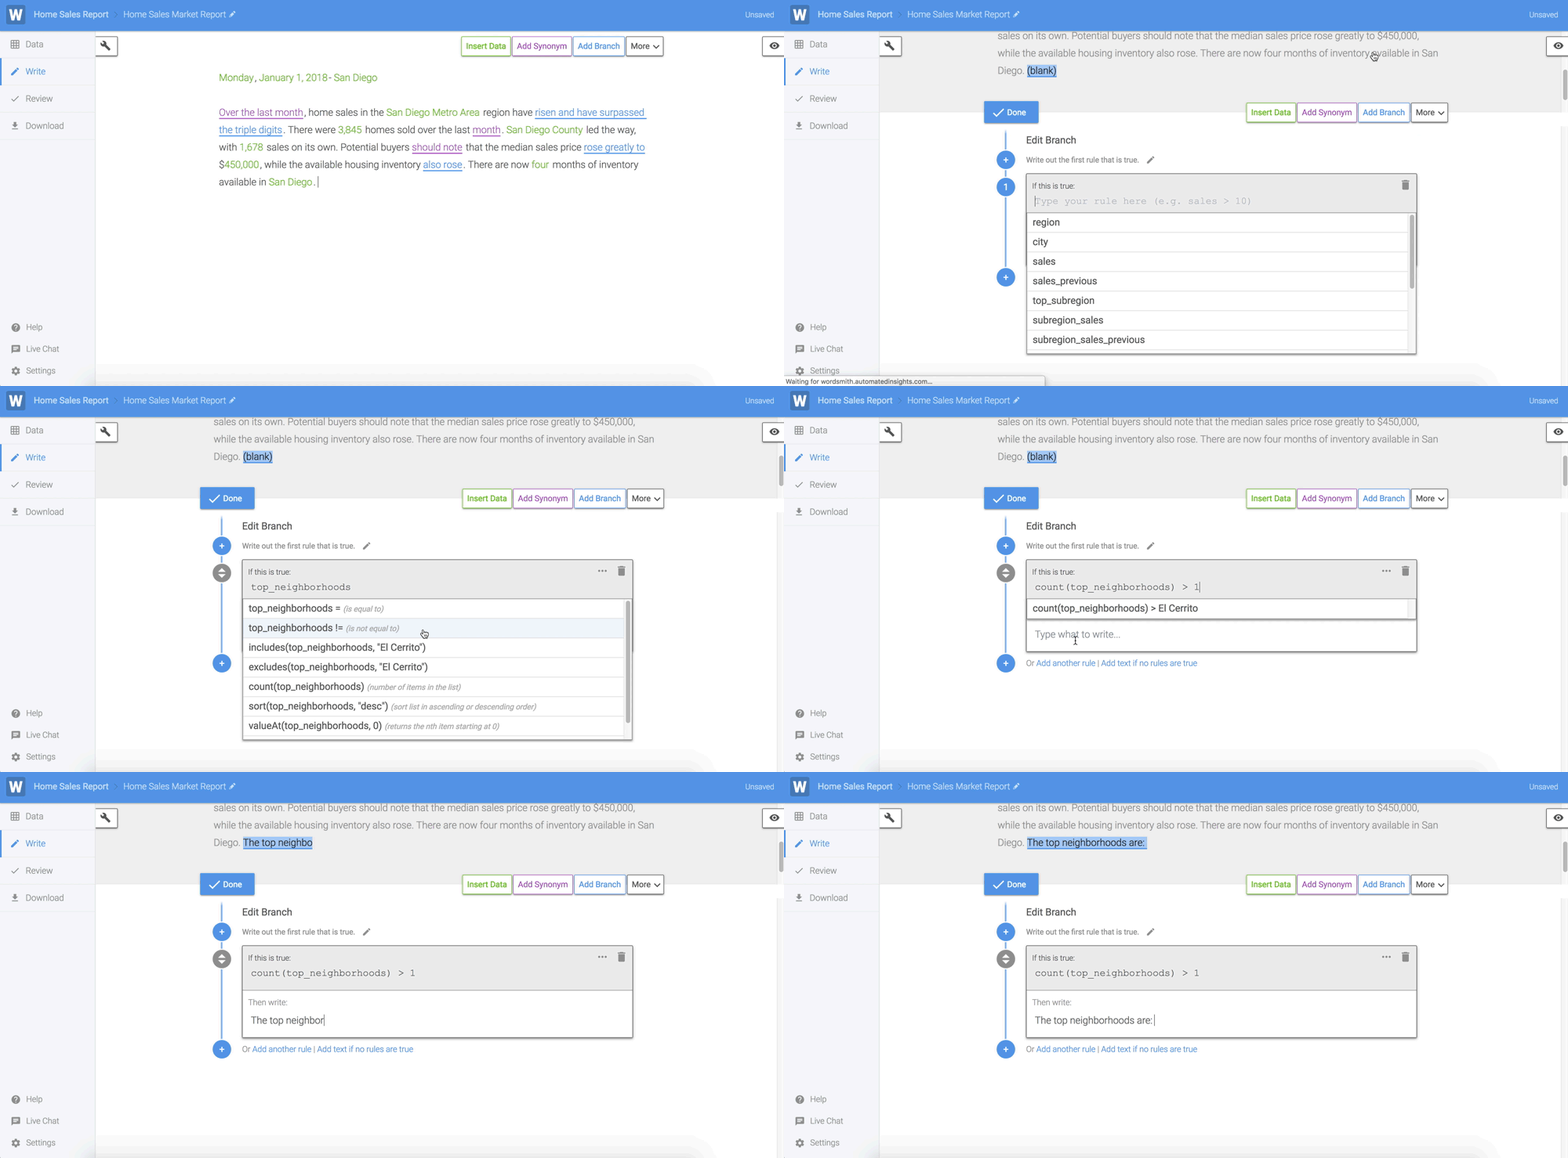
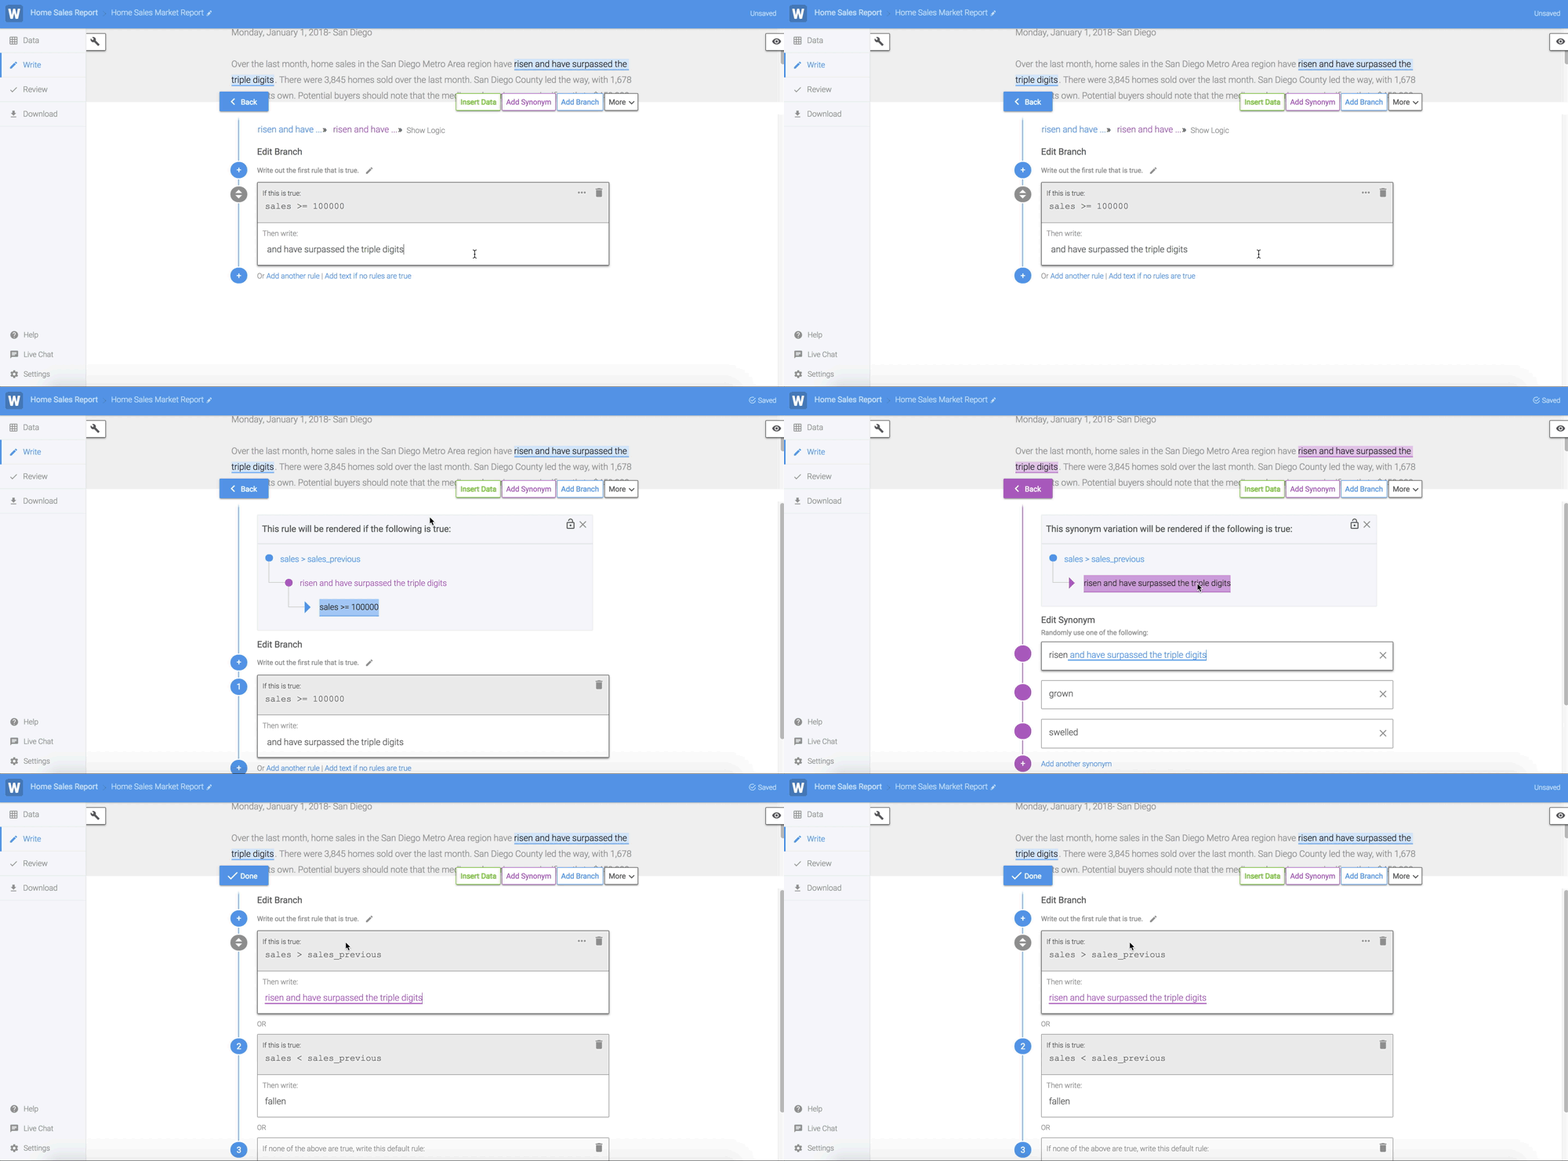
Branches are your way to make a decision in what's written in your narratives based on your data. You'll use conditional logic to write rules for scenarios that could happen in your data so that every narrative is accurate and unique.
When you open the Branch window by clicking "Add Branch", you'll see your Data Variables in a drop-down list. You'll use the Data Variables to write rules in the gray box, then type what you want written in your narratives if that rule is true.
Pro Tip: Wordsmith will auto-suggest operators you can use based on the data you select.
Show Logic
Use Show Logic to see the rules for the parent Branches in a nested Branch. It’s like the breadcrumbs you see in a Branch, but instead of the text that’s written, you'll see the logic that got you to the rule you’re writing. Because the parent logic has to be True in order for the child logic to also be True, showing the logic allows you to easily see the full Branch rule with all of the parent and child logic together. And as you write more complex Branches, you’ll always know where you are in the Branch structure.
Pro Tip: Click on the logic above the Branch to quickly navigate to a different level of the Branch.
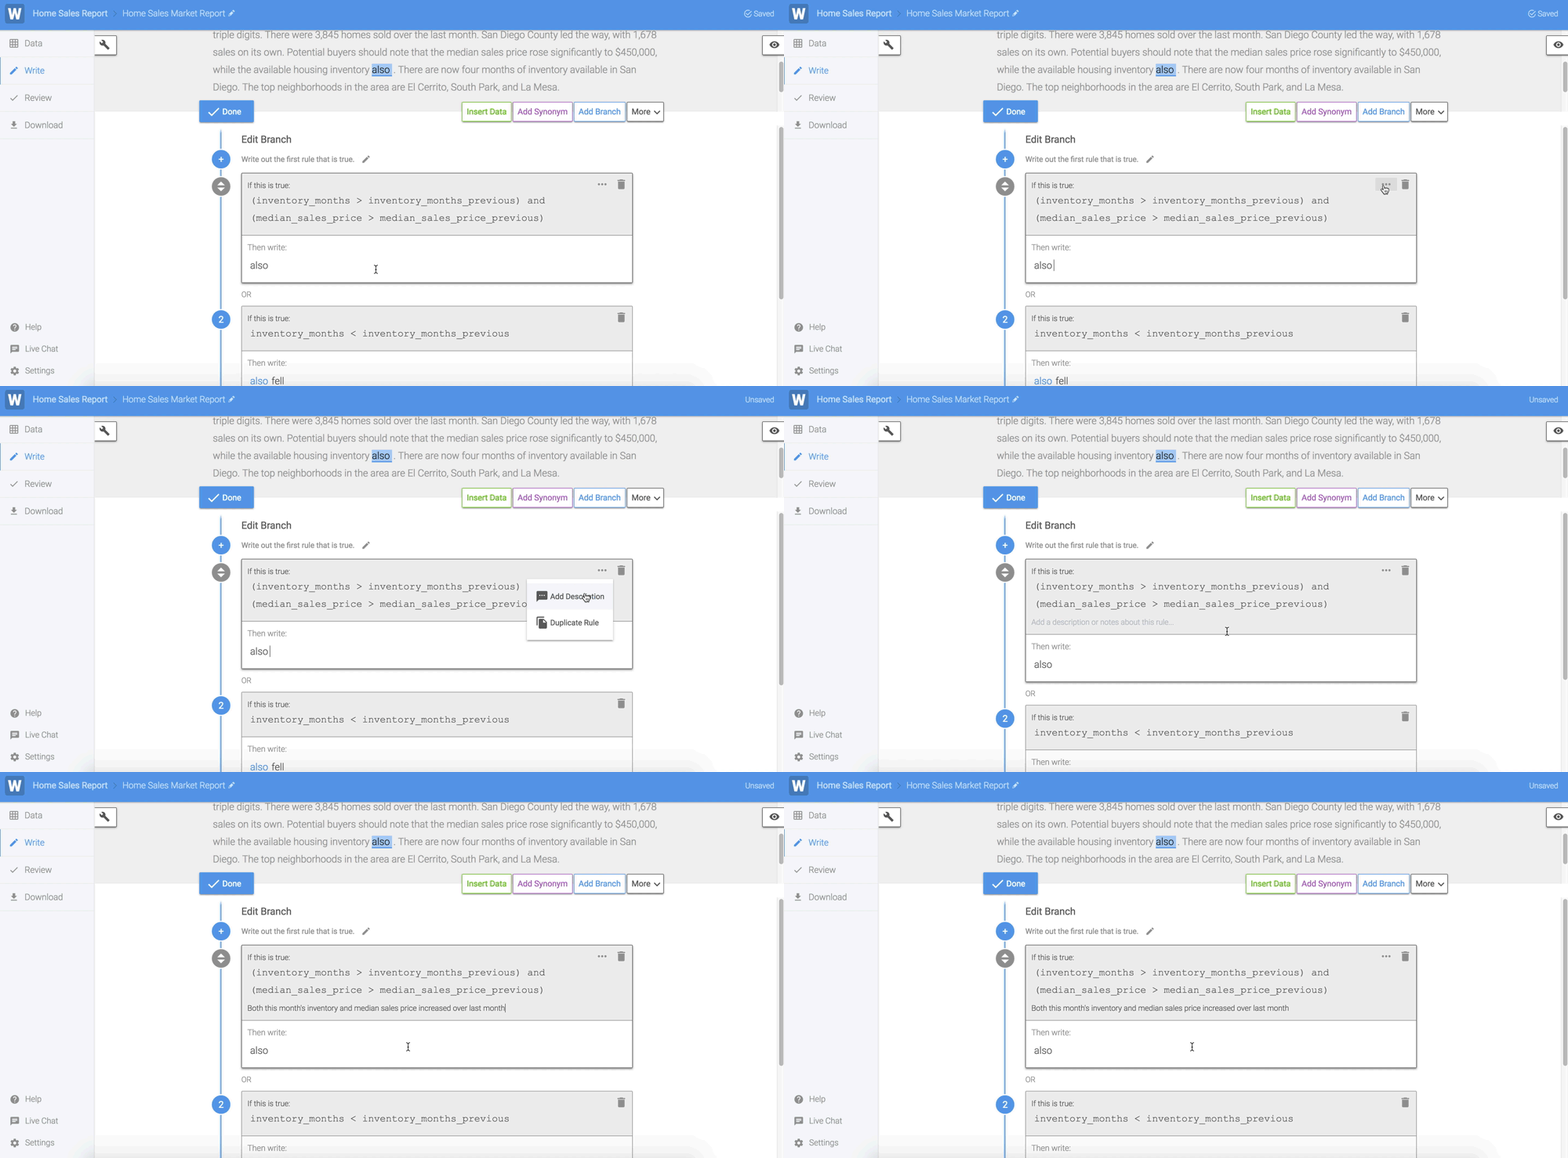
Add Description
Use Condition Rule Descriptions to add plain text notes to your Branch rules. You can use the descriptions to explain complicated logic in layman's terms, flag rules you want to revisit later, or add internal notes for your team. To add a rule description, click on the 3 dots in the top right corner of the Branch window.
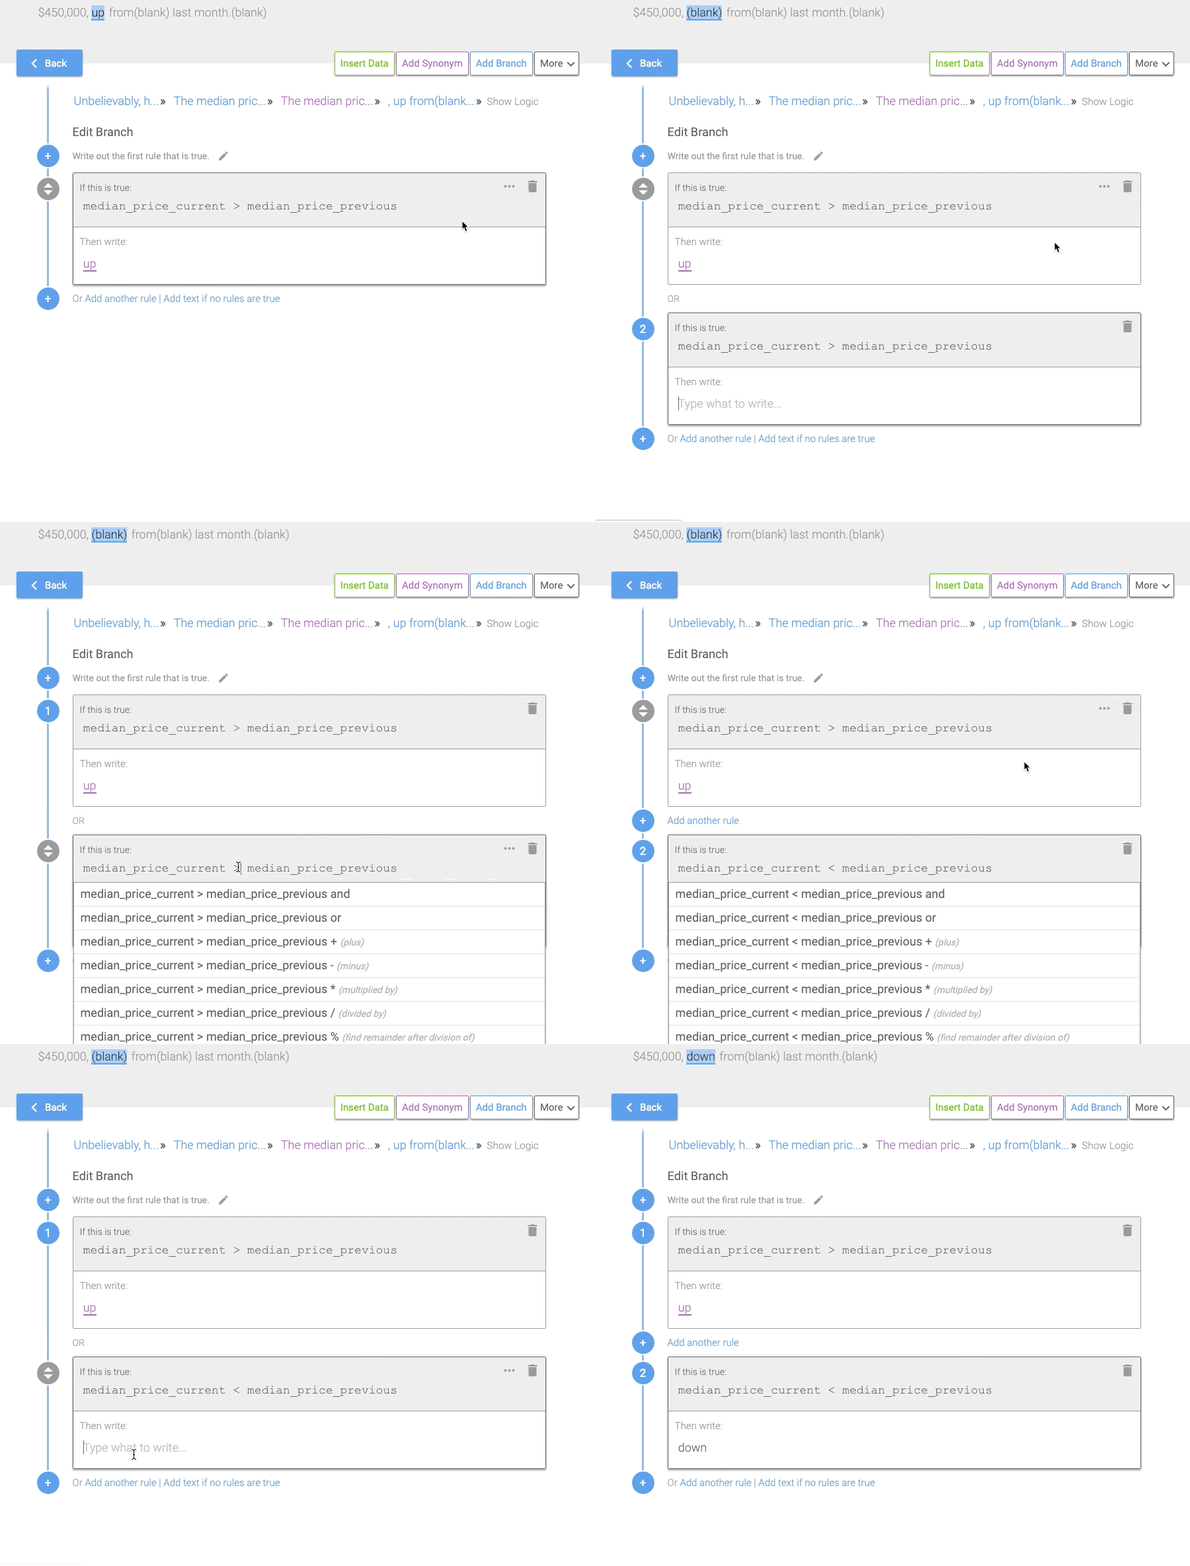
Copy Logic to New Rule
You can duplicate a rule within a Branch using the selection "Copy logic to new rule", available by clicking on the 3 dots in the upper right corner of the Branch window. This will copy the logic used in that rule and create another rule. You'll likely need to go back in and change part of the logic to apply to a new scenario in your data.
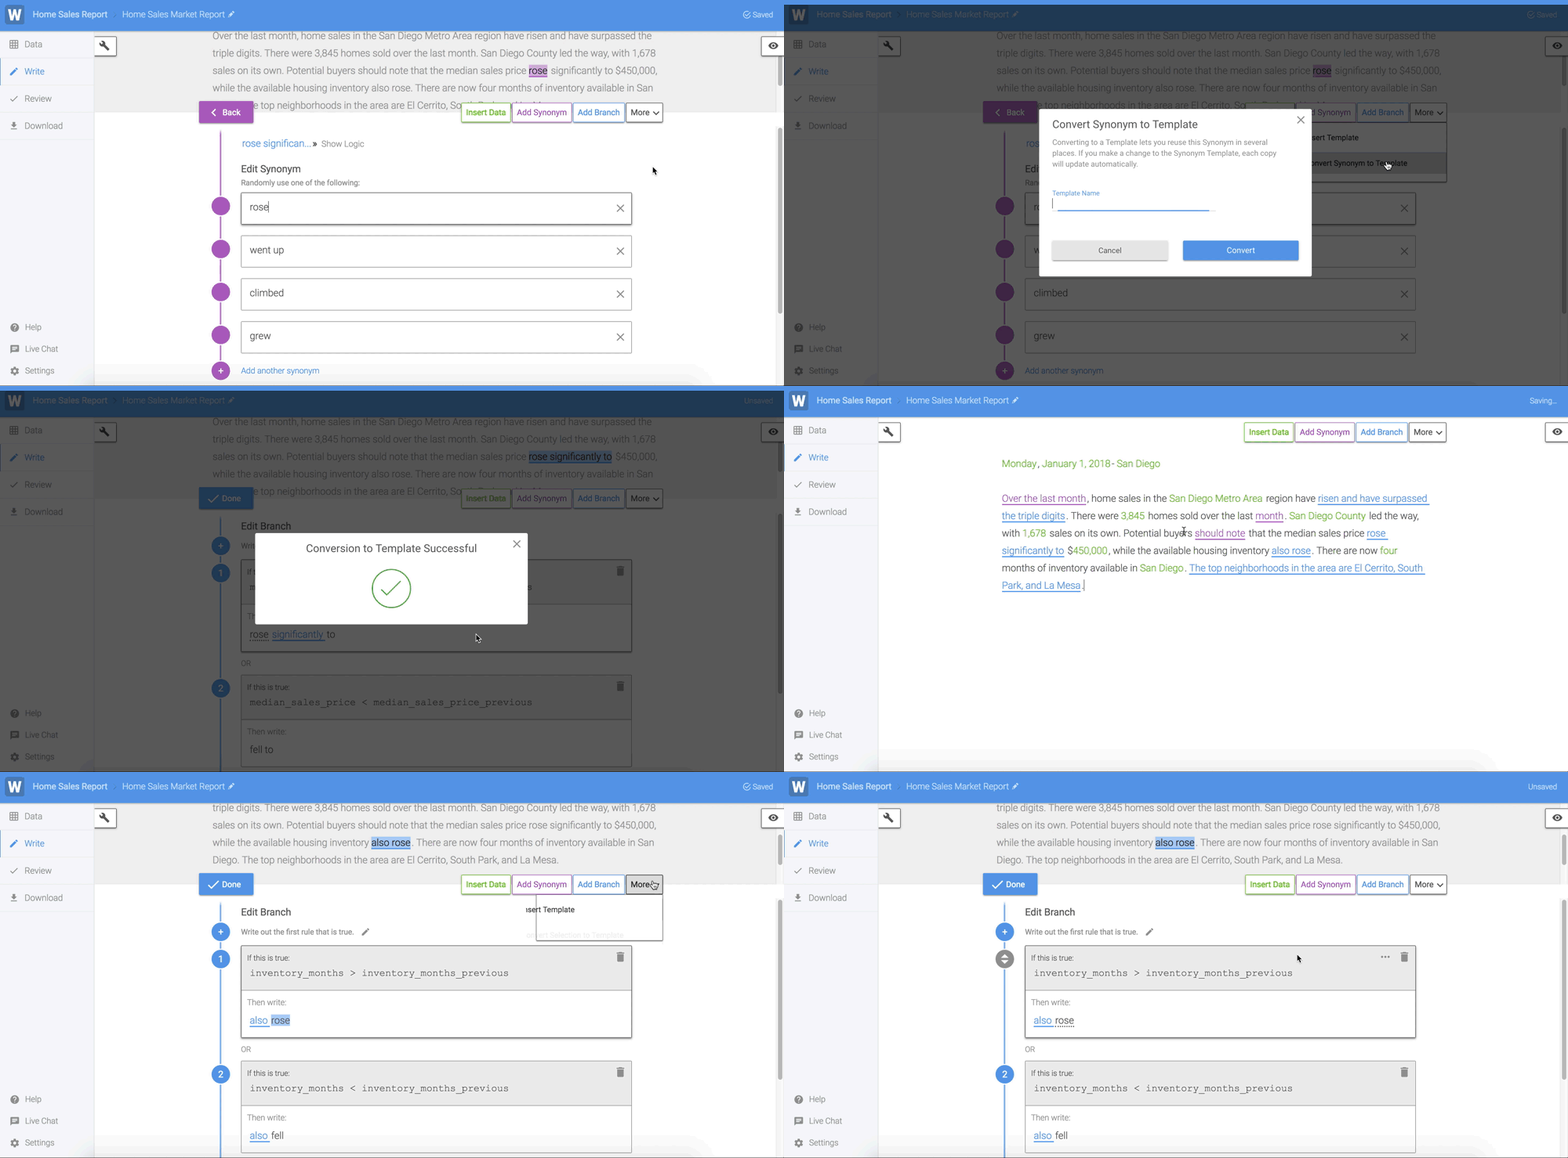
Insert Template
Inserting a Template allows you to add another Template from your Project inside your Template. You can use it to split up parts of a Template to divvy up work across your team, or reuse the same Branch or Synonym throughout your Template. When you create a Branch or Synonym, you'll see an additional option from the 'More' drop-down list to convert that Branch or Synonym to a Template. The best part about converting and sharing Templates across your Project is that you can edit something once and have those changes reflected wherever that Template has been inserted.
Pro Tip: If you find yourself copying and pasting in your Template, there's probably a way that inserting a Template can solve that situation a little bit better.
Outline
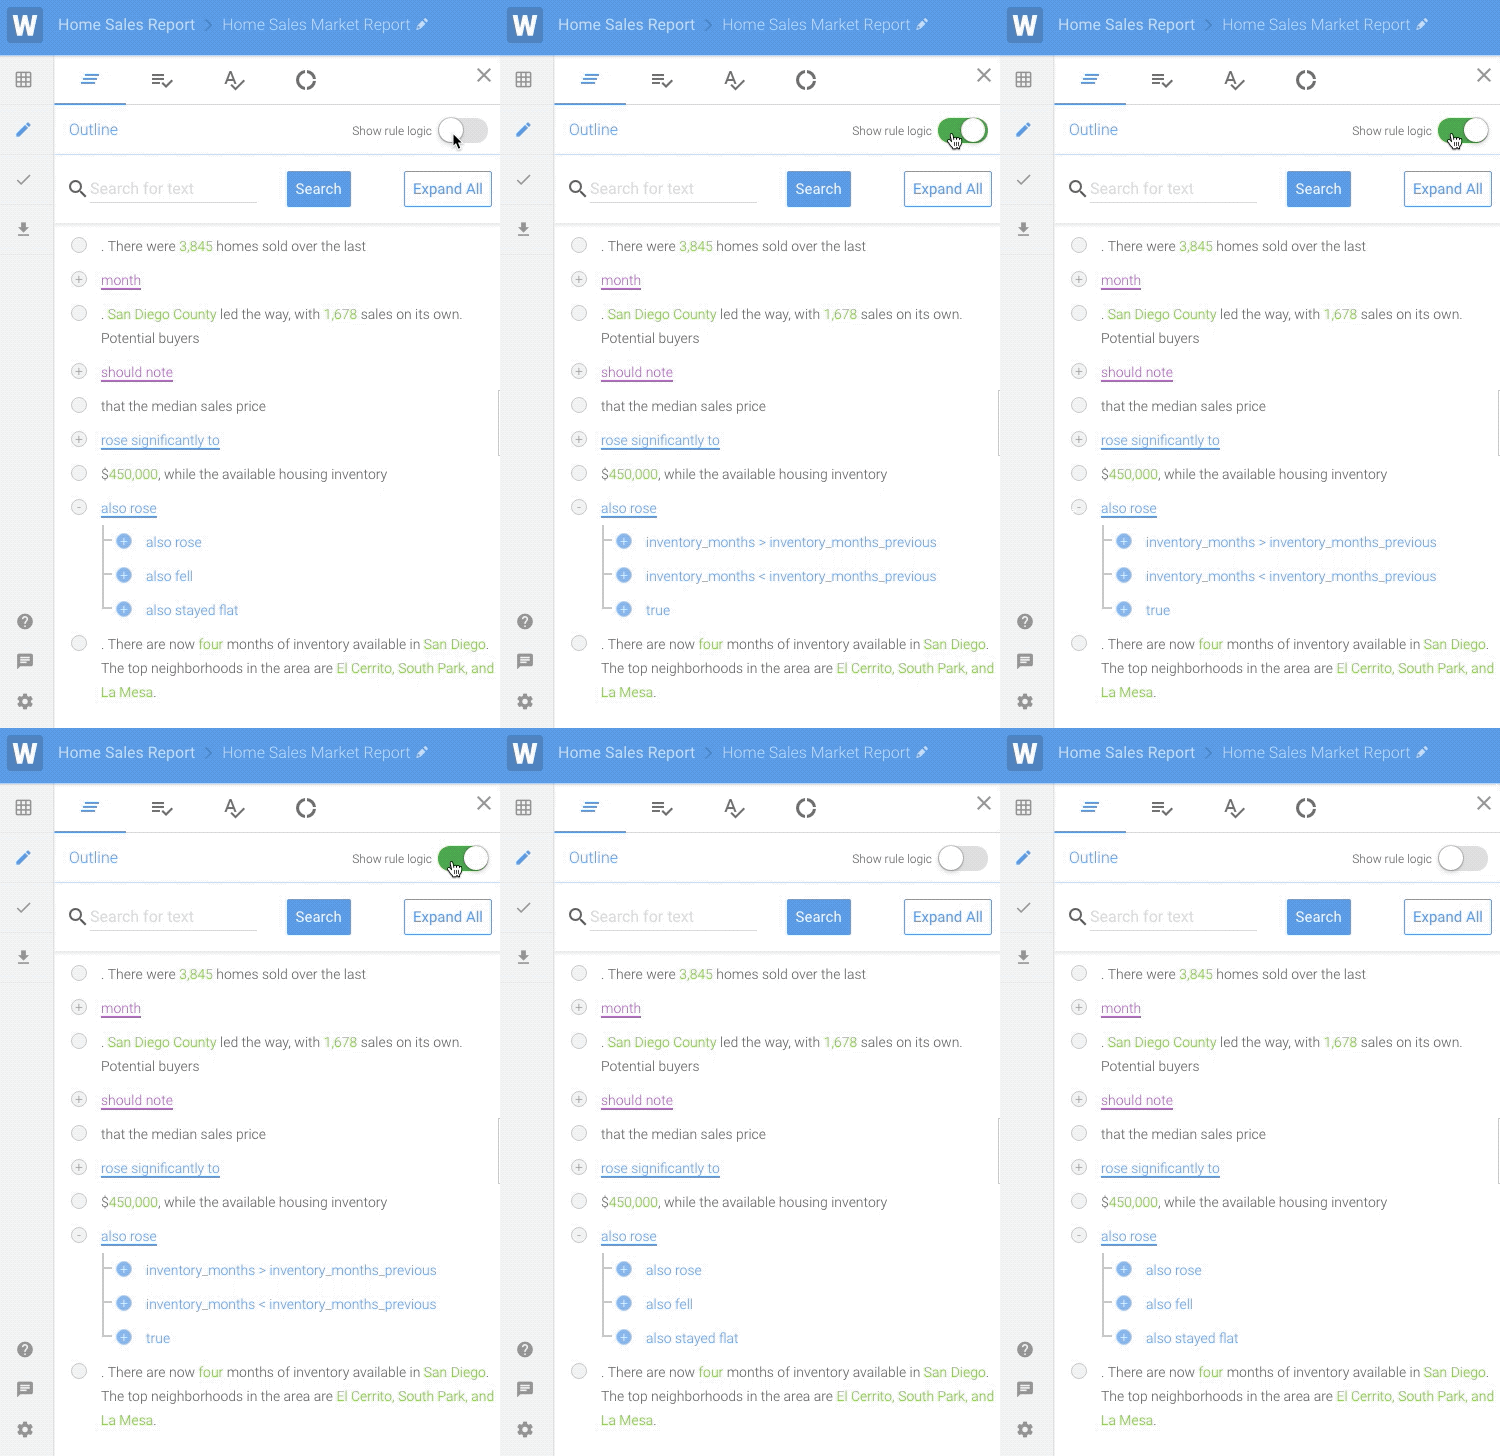
Outline makes navigating a complex Template easier by displaying the Template in a tree view with nested levels of Branches and Synonyms clearly visible. You'll see Outline as an option in the toolbar on the left side of your Template. Drag to resize the view and use the plus button in the top left to open or close all nested Branches and Synonyms at once. You can even click on parts of the outline to navigate directly to that part of your Template. Or search for a text string to find every occurrence in your Template (even in deeply nested Branches and Synonyms).
Pro Tip: To see what rules are written for each Branch in the outline, toggle 'Show rule logic'.
Data Tester
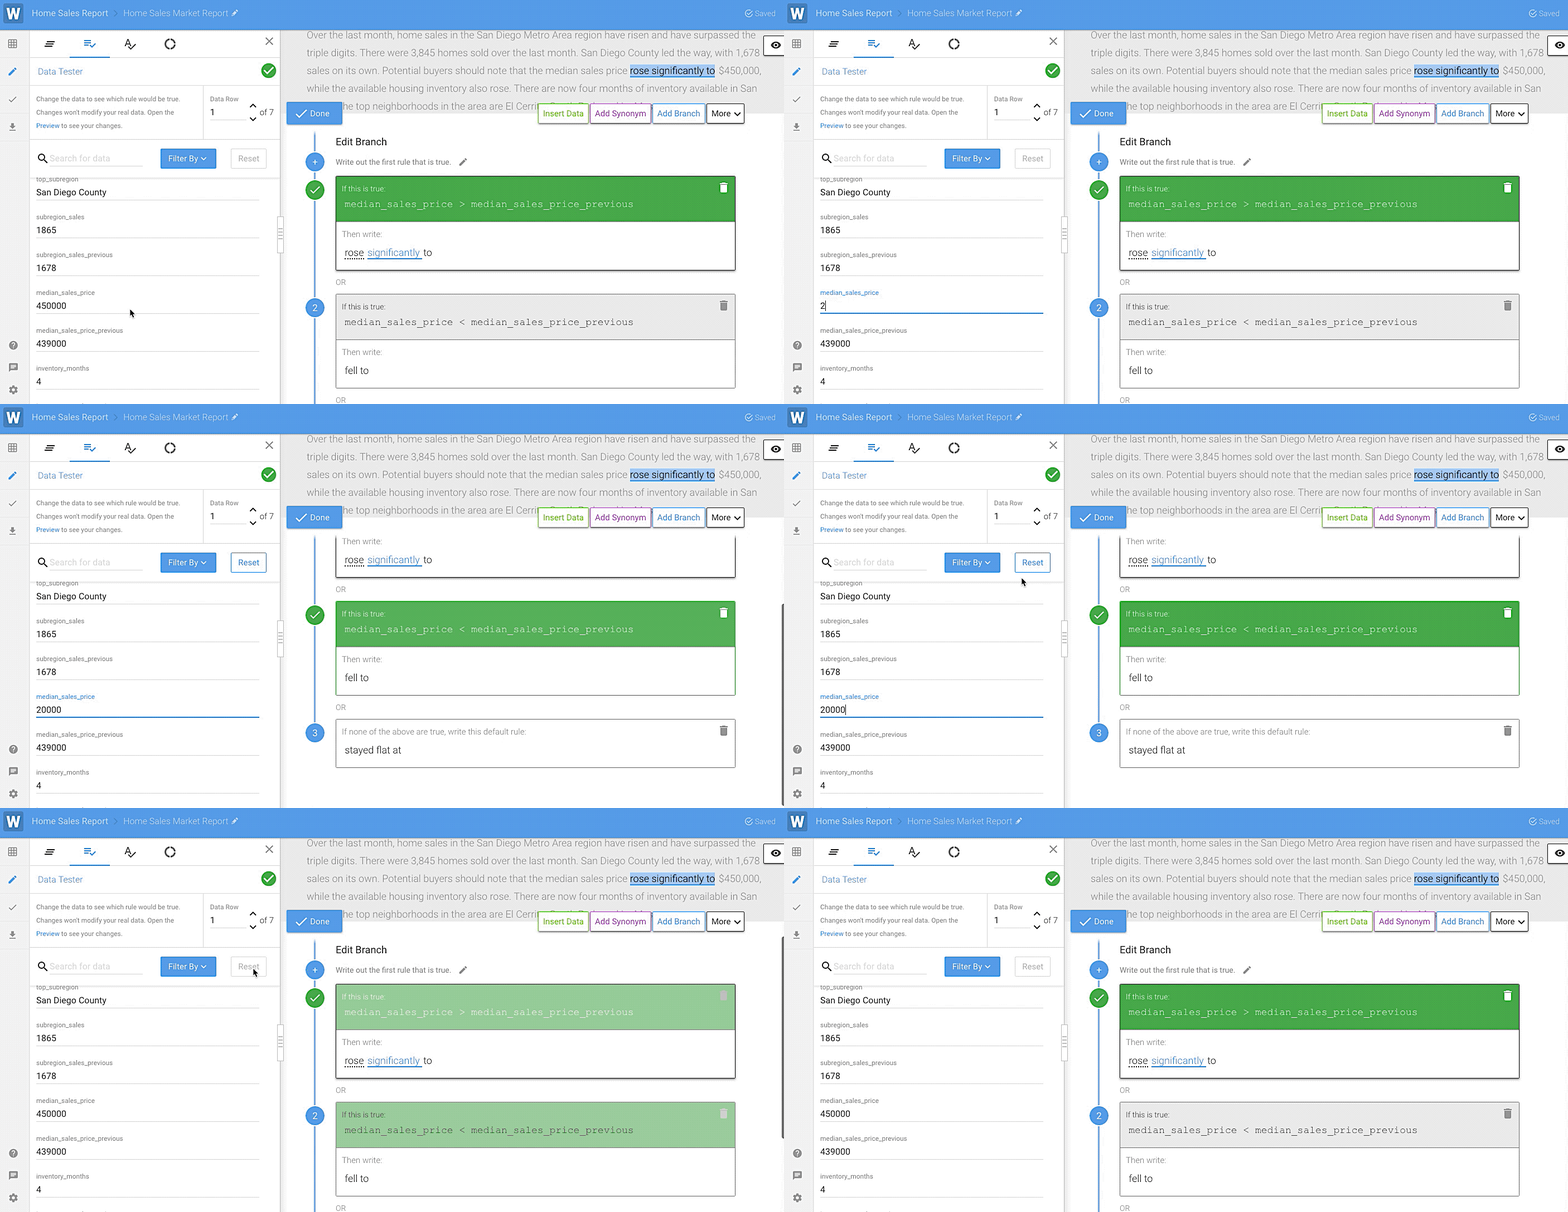
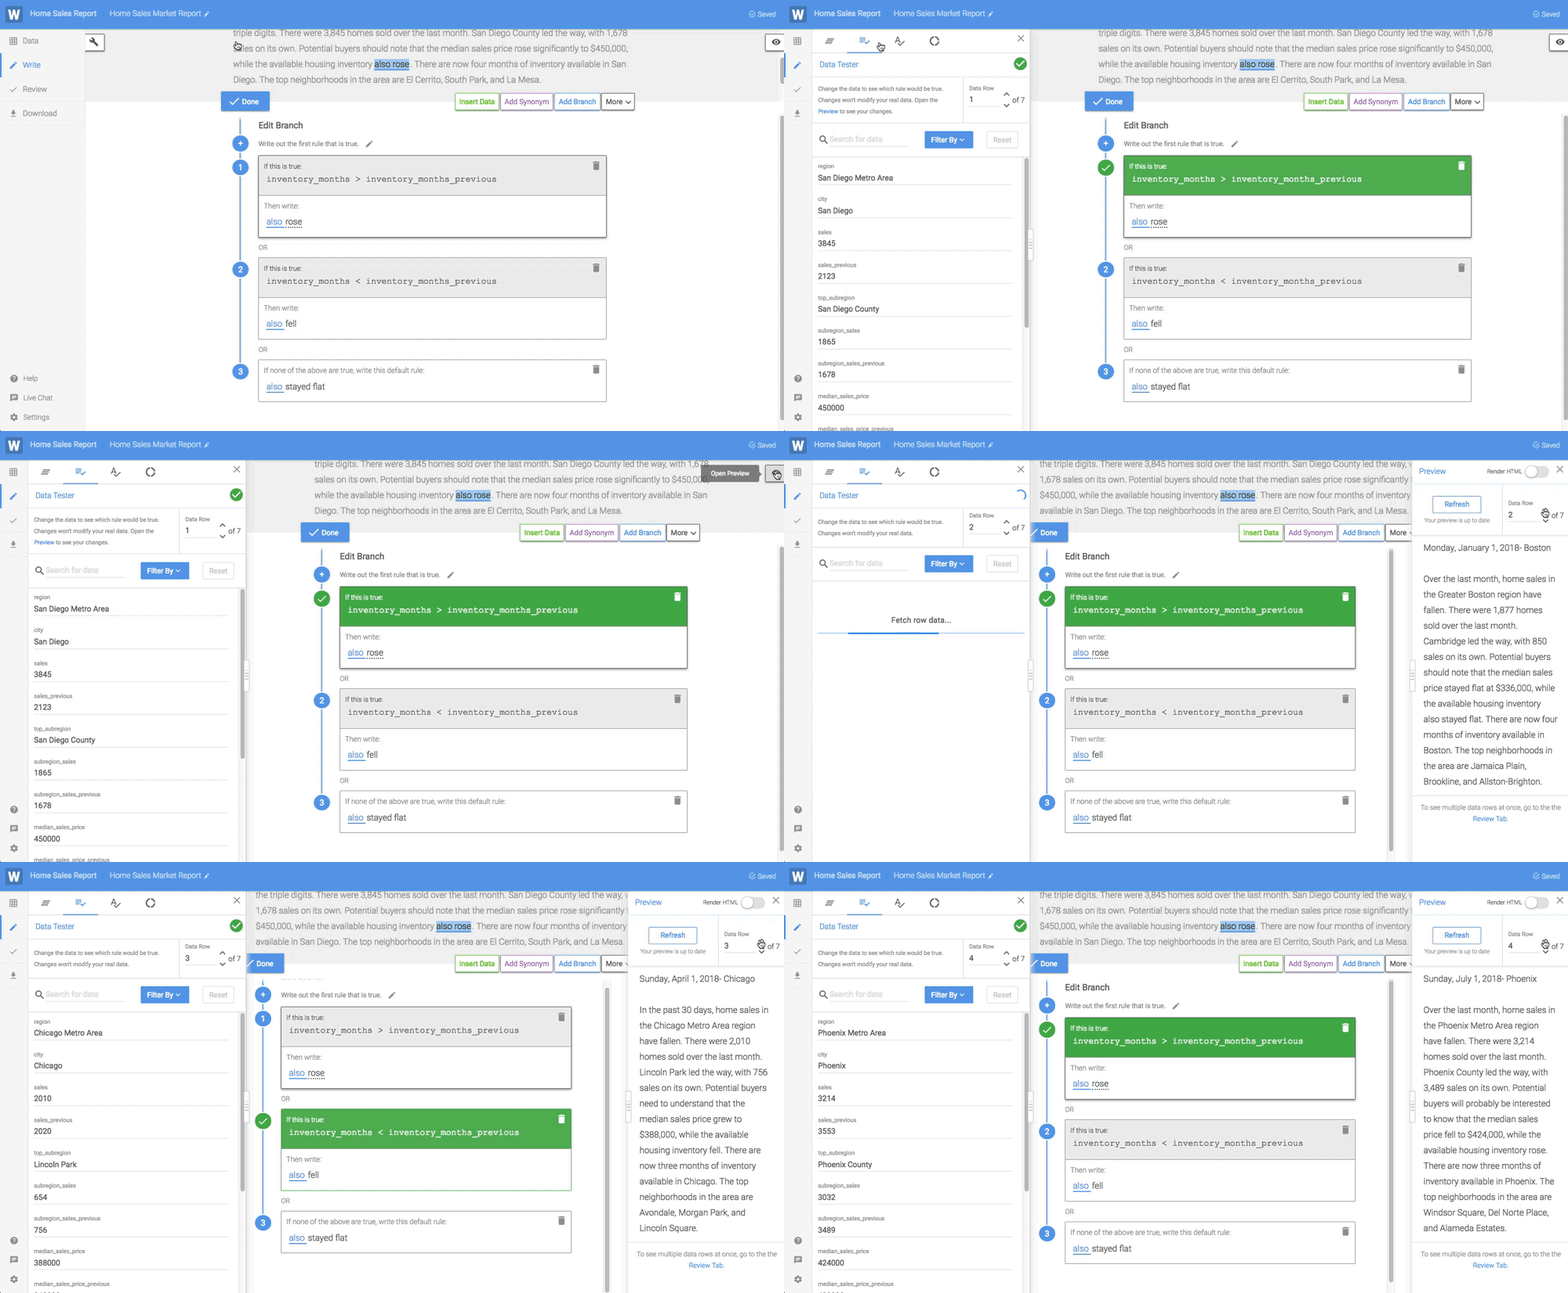
The Data Tester allows you to review your Branch rules and test your narrative within the editor, so you don't have to visit the Preview tab to pinpoint potential errors with your Branch logic. Navigate to the Data Tester from the toolbar and open a Branch in your Template. You'll see the data you've uploaded to this Project in the widget on the left, and the Branch Rule that will be written for that row of data will be highlighted in green. You can cycle through different rows of your data to see which rule will be written.
Pro Tip: Check your Branches by typing new data directly in the data panel on the left. This won't affect the data you've uploaded to the Project, and you can always restore previous values in the Data Tester.
Spell Check
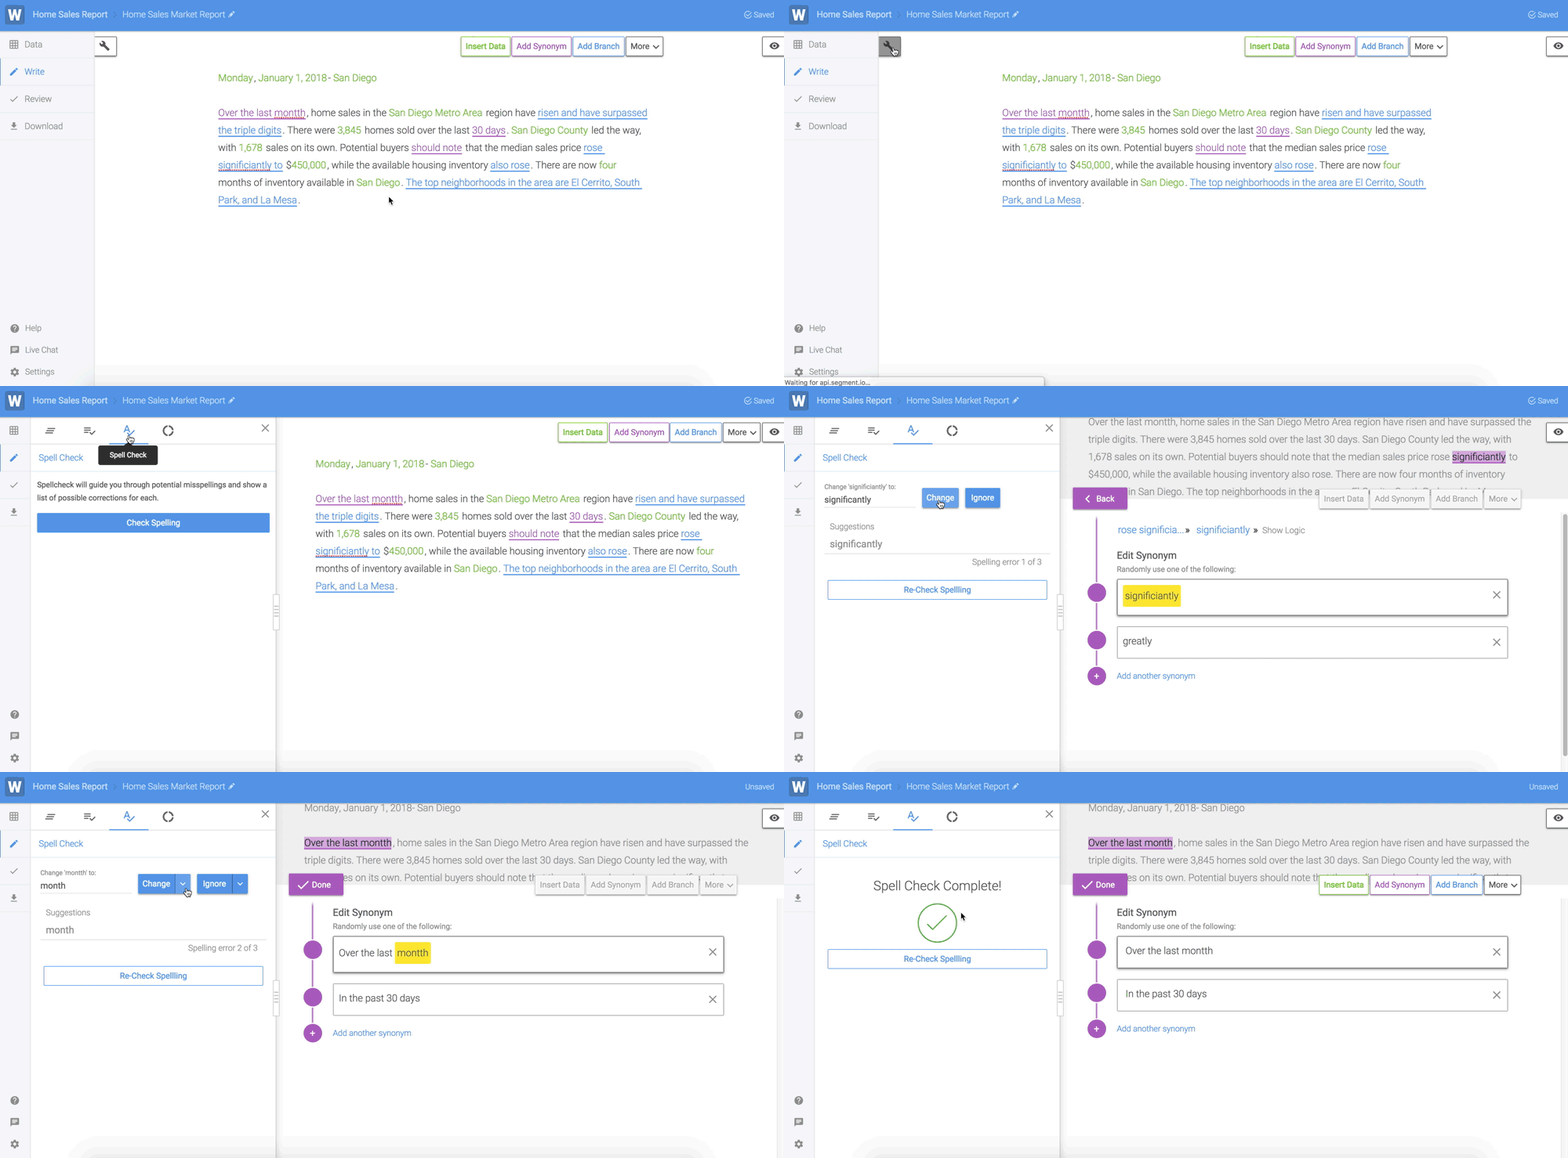
You'll find Spell Check under the More tab. Spell check functions like most other word processor spelling tools - you can choose a pre-selected spelling suggestion, write your own, or ignore. You can also edit just one instance or all of them.
Pro Tip: If there are multiple occurrences of the same typo, select "Change All" to update them all at once.
Variability Guide
Variability is a measure of how different your narratives are from each other. The Variability Guide can help you identify the parts of your Template that are producing similar text in your narratives. For example, if the same text is included in every narrative generated from your Template, that text will be flagged. You can choose if you’d like to add more variation to it, like adding a Branch or Synonym, so that it won’t be as common in your narratives.
The Variability Score is a metric you can use to evaluate how much variation exists within your template at a glance. A high Variability Score may not be needed, or even preferred, in every scenario. Low variability is suitable for business reports where consistency is helpful. Medium variability works for most types of narratives. And High variability is best when users will read several narratives at a time and you want to limit repetition. It's also ideal for SEO.
Additionally, your Variability Score can be affected by your data. The more lines of data you have, the more chances you have for your narrative to differ, thus raising your variability along with the Variability Score.
You can determine what level is right for your narratives. Your Template will be scored between 0 and 100, with 0 being the lowest variation (meaning your narratives are all very similar) and 100 being the highest variation (all of your narratives are very different).
Pro Tip: You can use the Variability Guide in both the editor and the Review tab.
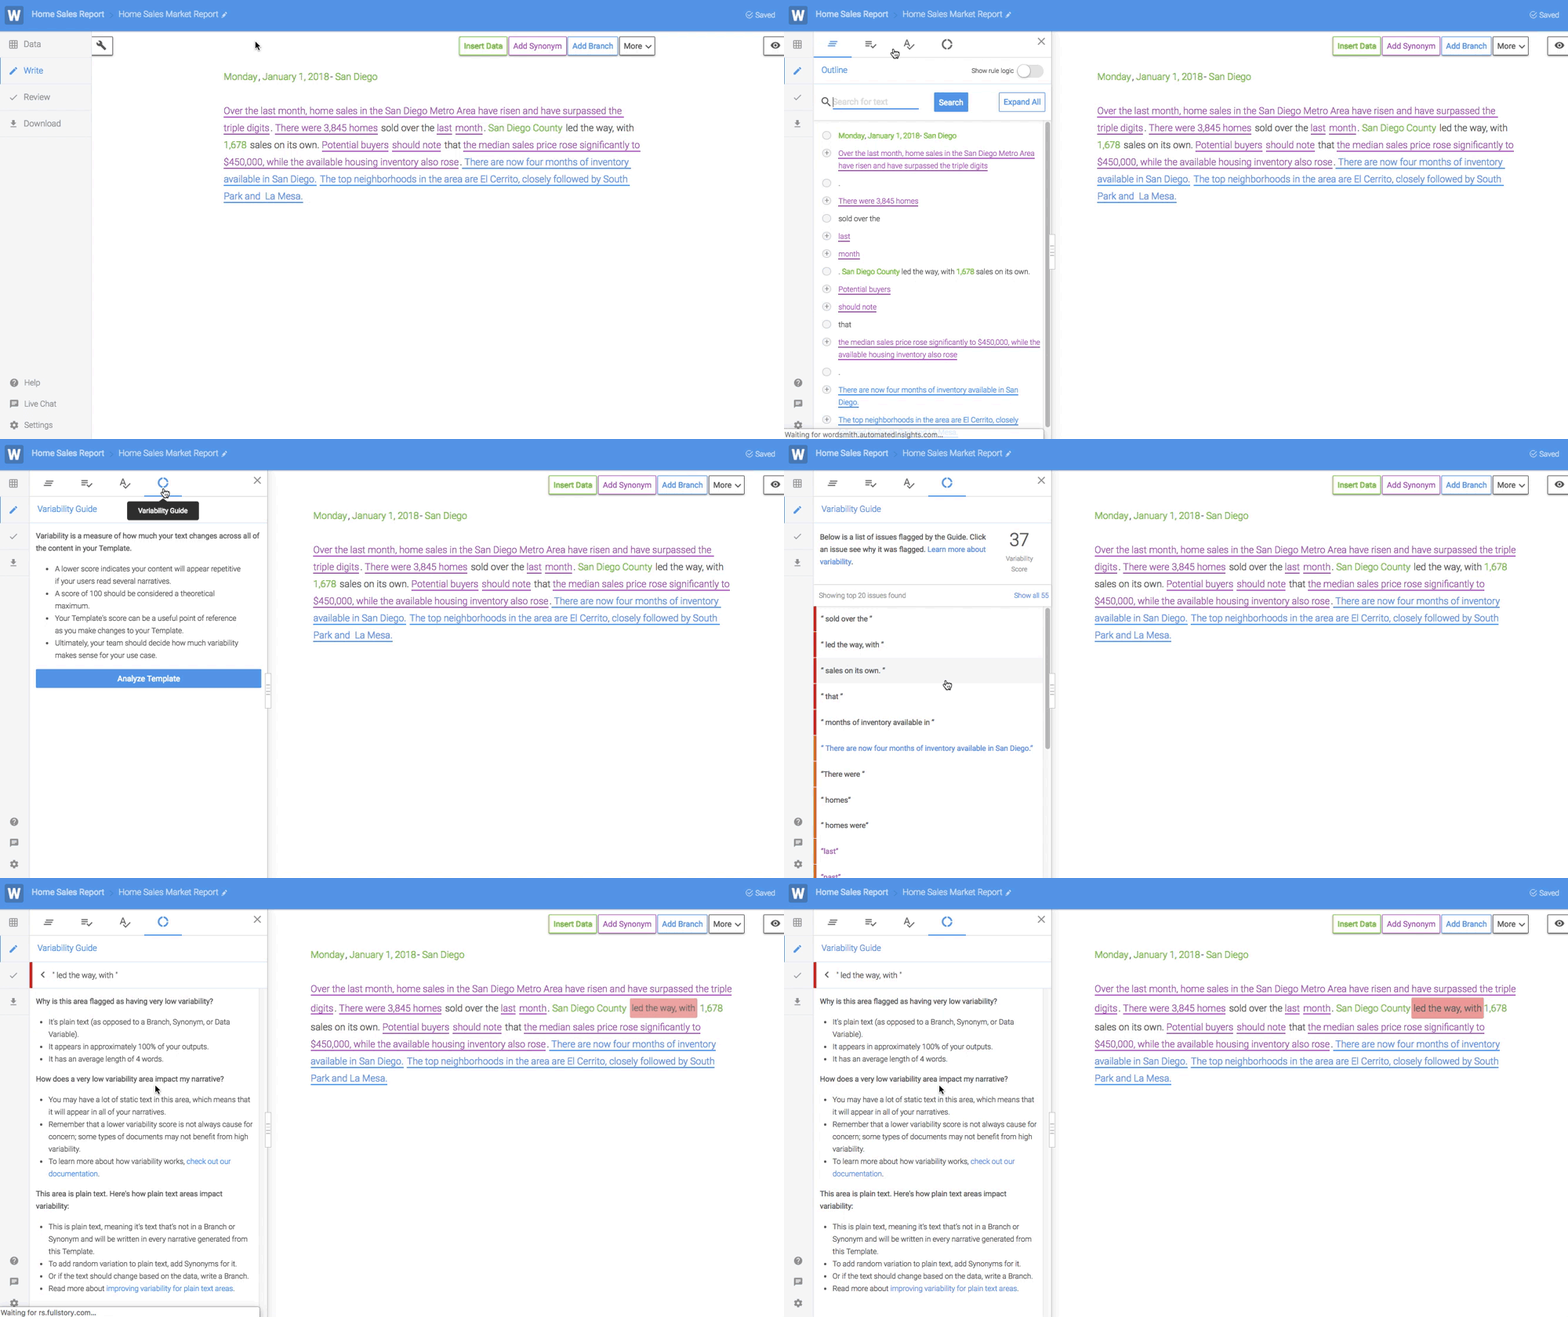
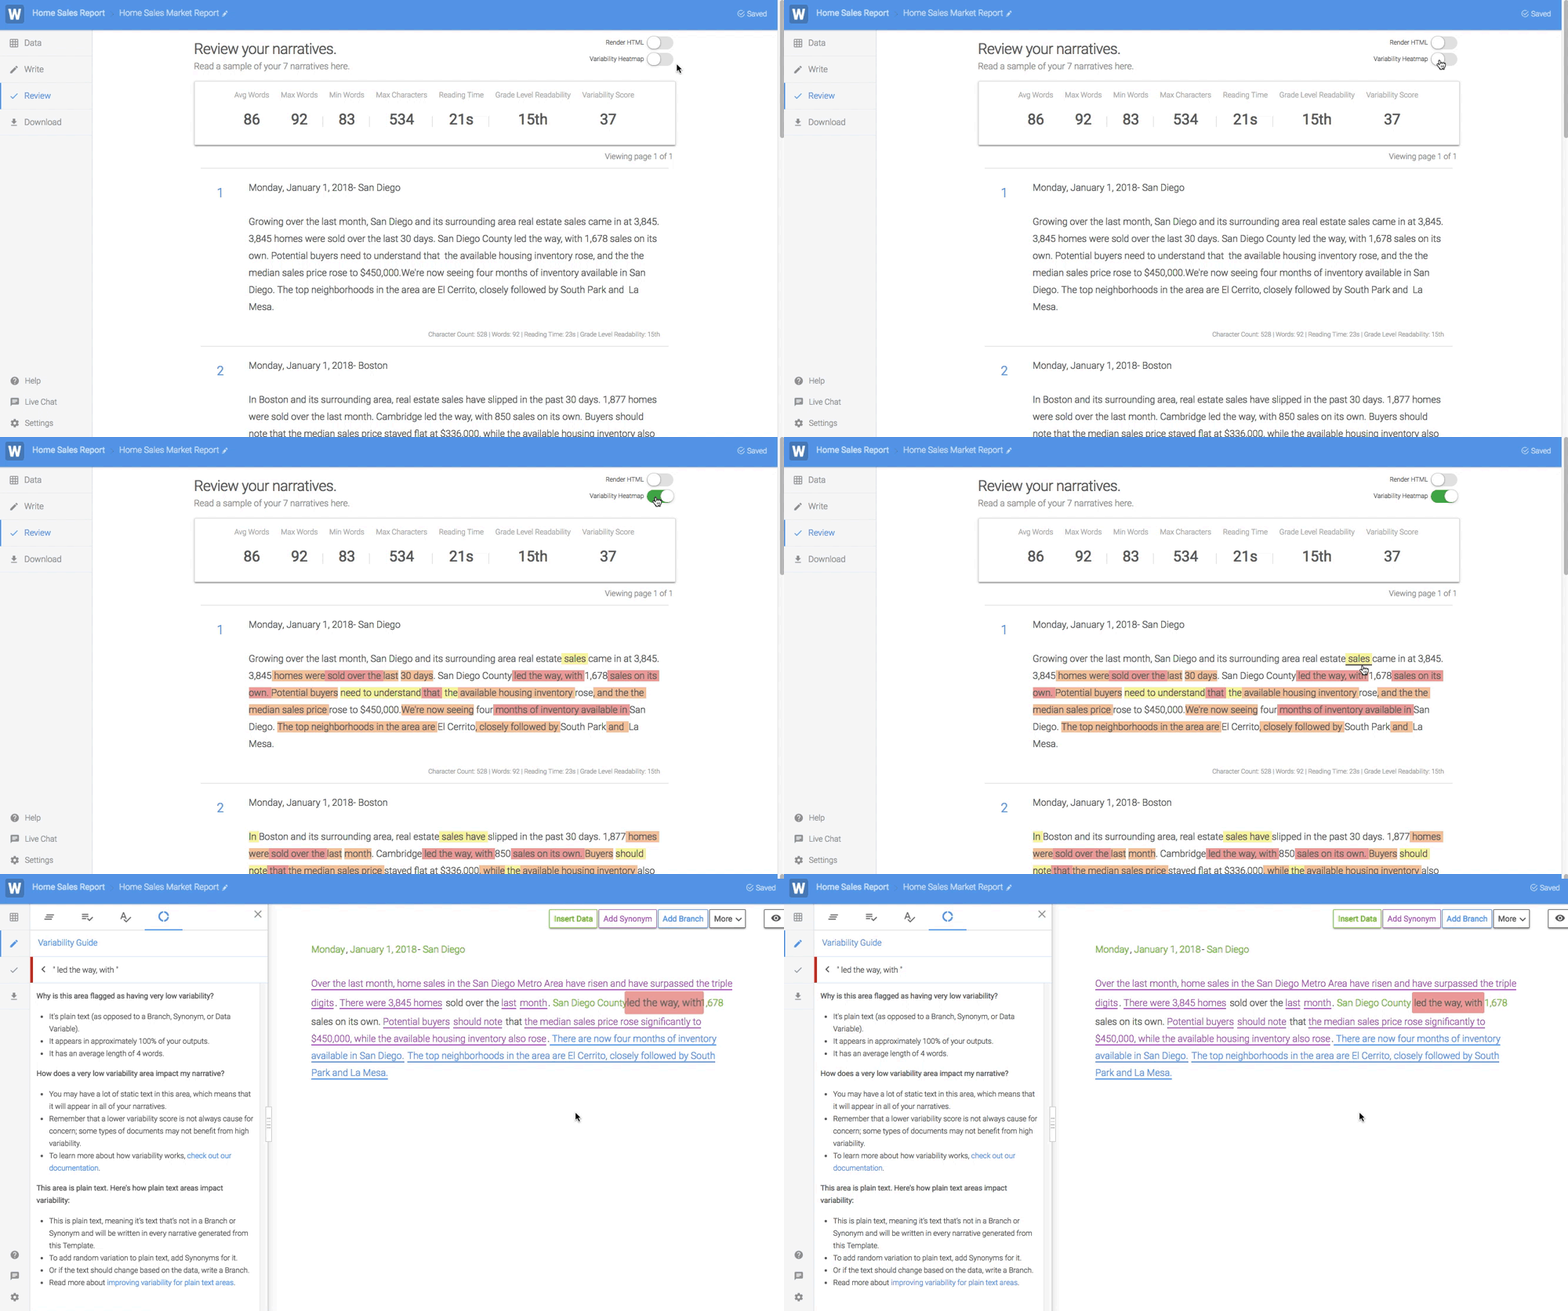
To use the guide in the editor, open the tools menu, click the circular Variability Guide icon, then click “Analyze Template.” You’ll see your Variability Score, as well as a list of highlighted words and phrases with low variability. Click on a highlighted phrase to see where it is in your Template, as well as additional insights about why it was flagged.
In the Review tab, you can toggle the Variability Heatmap to see the least variable words and phrases highlighted in your sample narratives. Click on a highlighted section to open the Variability Guide in the editor.
Preview
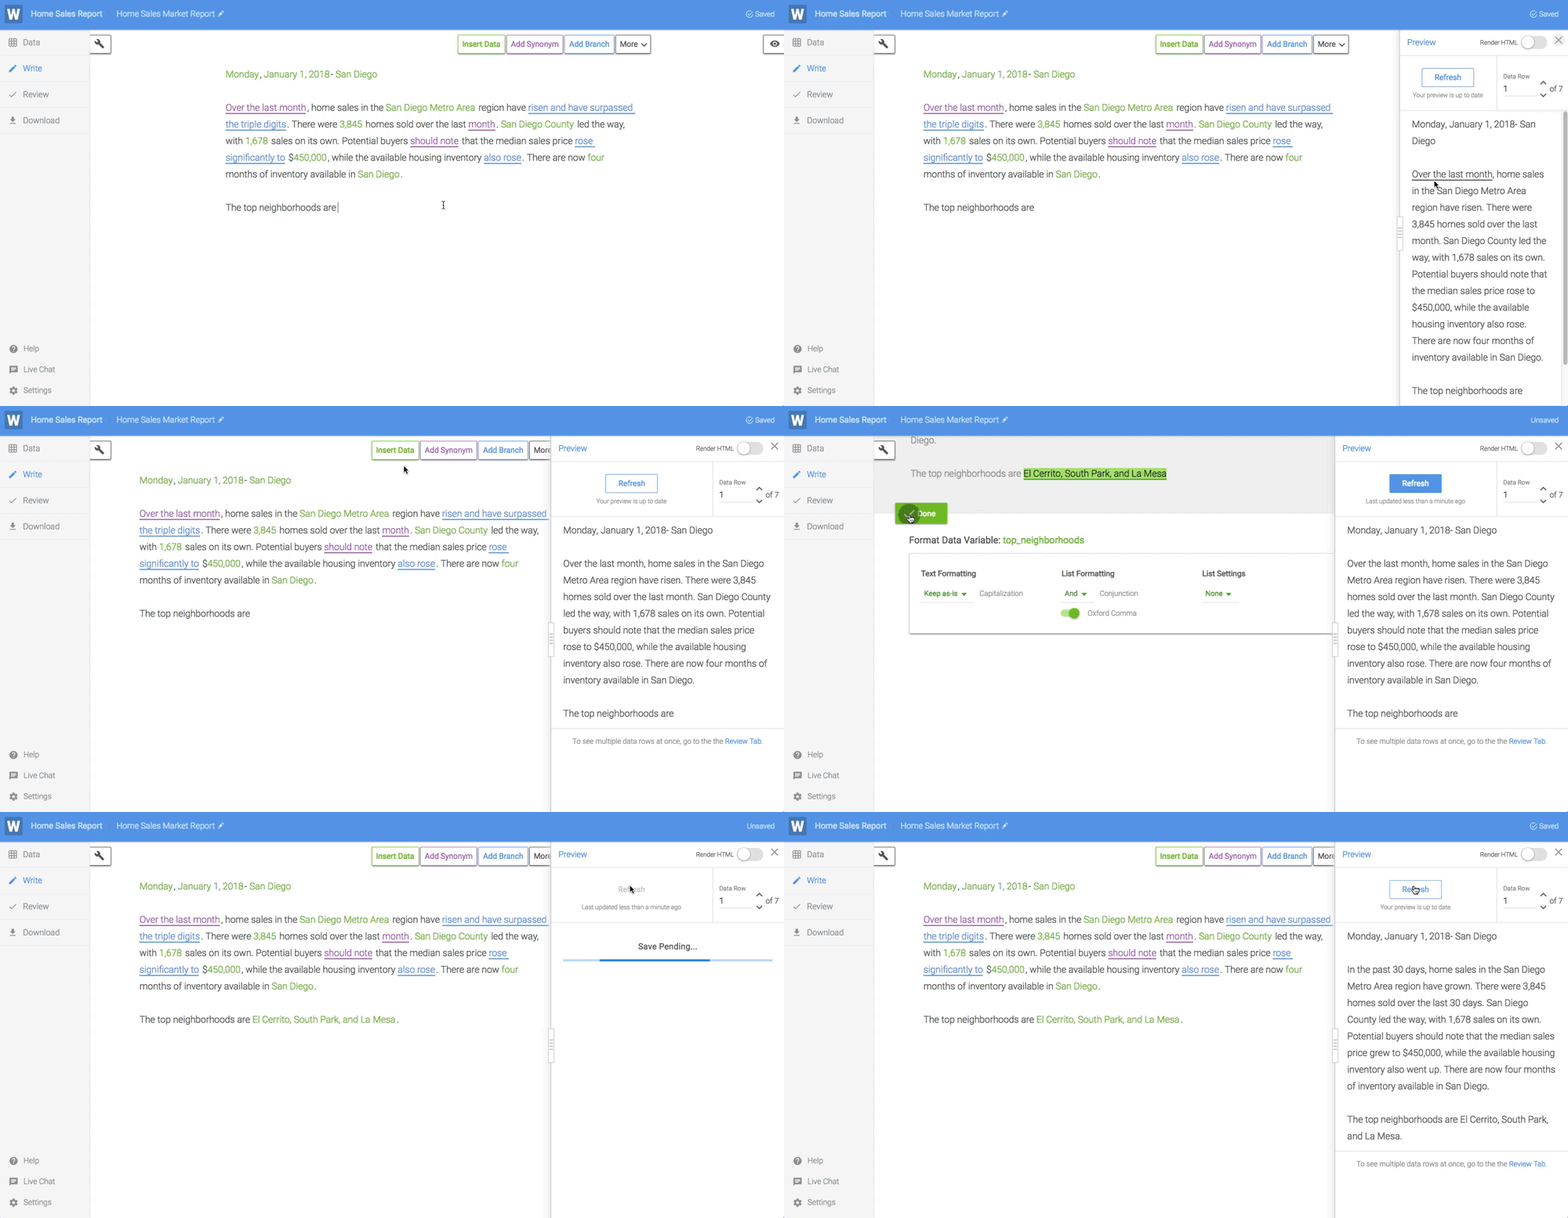
The Preview tool in the editor allows you to see a live preview of your narrative side-by-side with your Template. Whenever you make an update to your Template, you can see how it affects your narrative for each row of data right away inside the editor. To open the Preview tool, click on the eye icon on the right side of the page. Once you've made a change to the Template, you can refresh the preview to see that new change in your narrative.
It also syncs with the Data Tester, so you can see how your data affects your narratives in real-time. Open them both, and as you scroll through the rows in one, you'll see that the other refreshes as well. You can see how your Branches will be evaluated for different scenarios in your data, as well as the resulting changes to your narrative.
Updated over 6 years ago
