Wordsmith Calculations
Writing calculations in Wordsmith is how you transform the underlying data powering your Tableau visualizations into just the relevant Data Variables you want to write about in your narrative. Calcs are just functions, like Aggregate or Group, performed in a step-wise fashion on a data table.
Why Write Calcs
In order to write about key insights in your dashboard, you'll need to pull out Data Variables from the underlying data. For example, if you want to write about the top salesperson in your dashboard, you'll probably need at least two Data Variables - 1) who that top salesperson is, and 2) what their sales numbers are. If you don't already have the Data Variables you need in the data coming from Tableau, you can write calcs to transform the underlying data to get those Data Variables.
Or if you're more comfortable writing calcs in Tableau or MicroStrategy, or already have the data you need in your underlying data, then you can just pass those Data Variables through by selecting the columns you have in your table. You'll need to Select the columns in your table you want to use in Wordsmith and assign data variable names for them by giving the calc a name. All columns saved in one calc will become unique Data Variables named by the column header appended to the calc name.
Creating Calcs
Click on "New Calc" next to the table that contains the relevant data for the calc you want to create. You'll see a selection of functions and the table of data below them. You'll add those functions in a series of steps to transform the data table into what you need. Every column in the data table will become a Data Variable that you can use in your Template. As you add steps, the table will update accordingly. When you have your table narrowed down to the one or more Data Variables you need, click "Save calc".
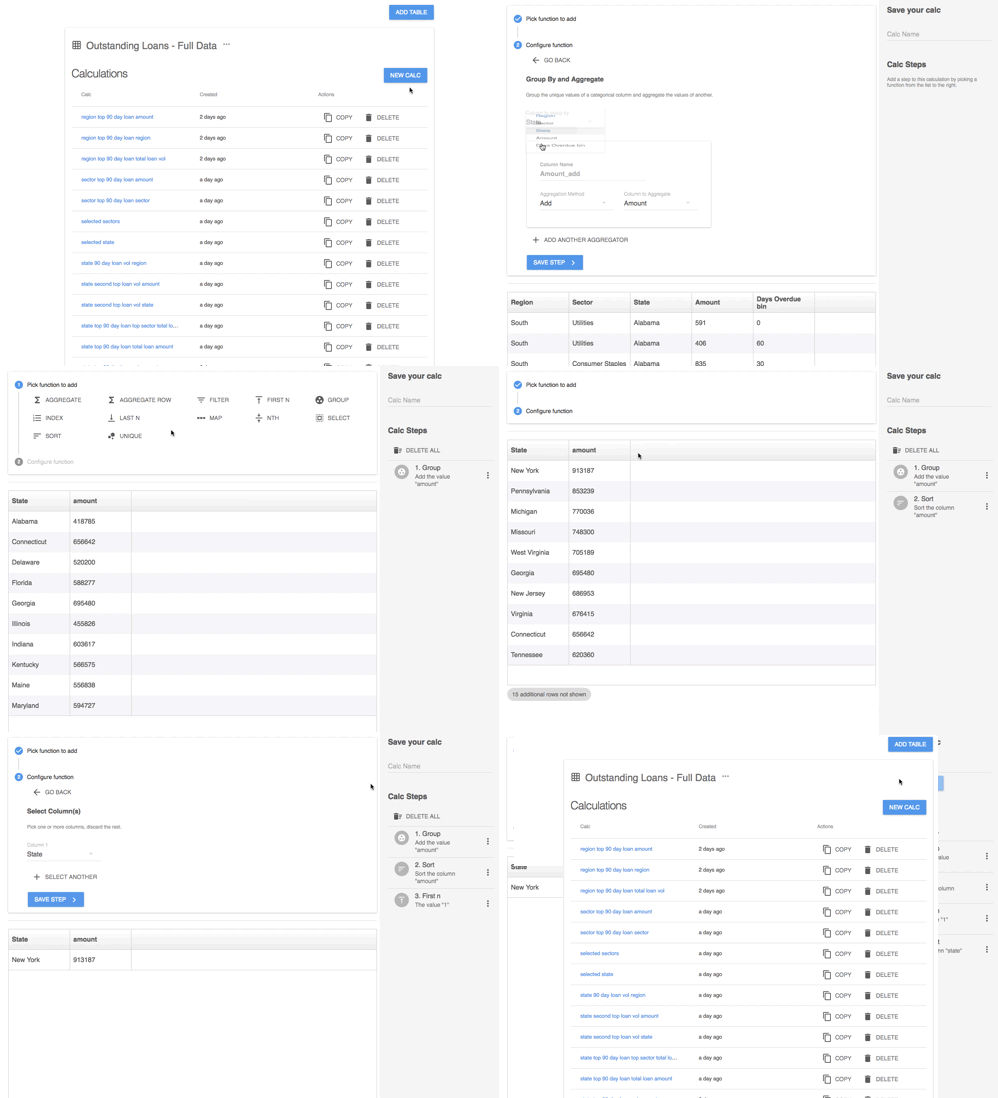
Edit Steps in a Calc
Deleting all steps will remove everything and start your calc from scratch.
Reverting to a previous step will delete all steps after that step.
And editing a step will allow you to make a change to a previous step while preserving every other step in the calc.
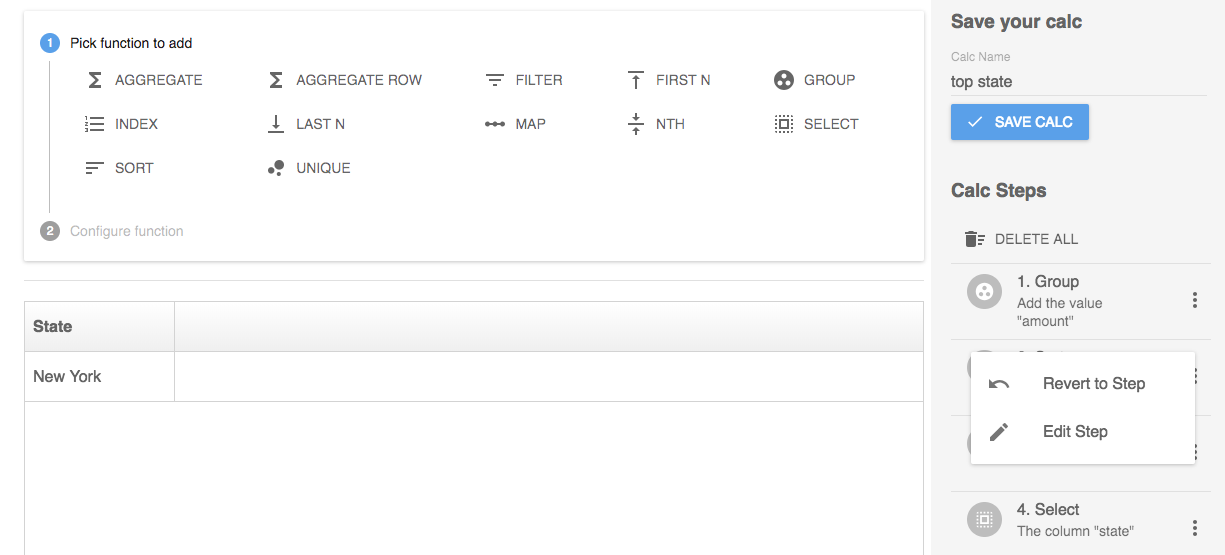
Copy Calcs
You can copy any calcs you've already created and choose to copy them into the same worksheet or another worksheet. If you want to reuse the same steps in a new calc, you can copy that calc into the same worksheet and then edit any of the steps you need to. If you'd like to have the same calc in two different worksheets (e.g. one that is filtered by user interactions and one that isn't), you can copy a calc and then select the worksheet you want to copy it to. Just make sure the new worksheet has the same data schema (columns in the data table) as the original calc.
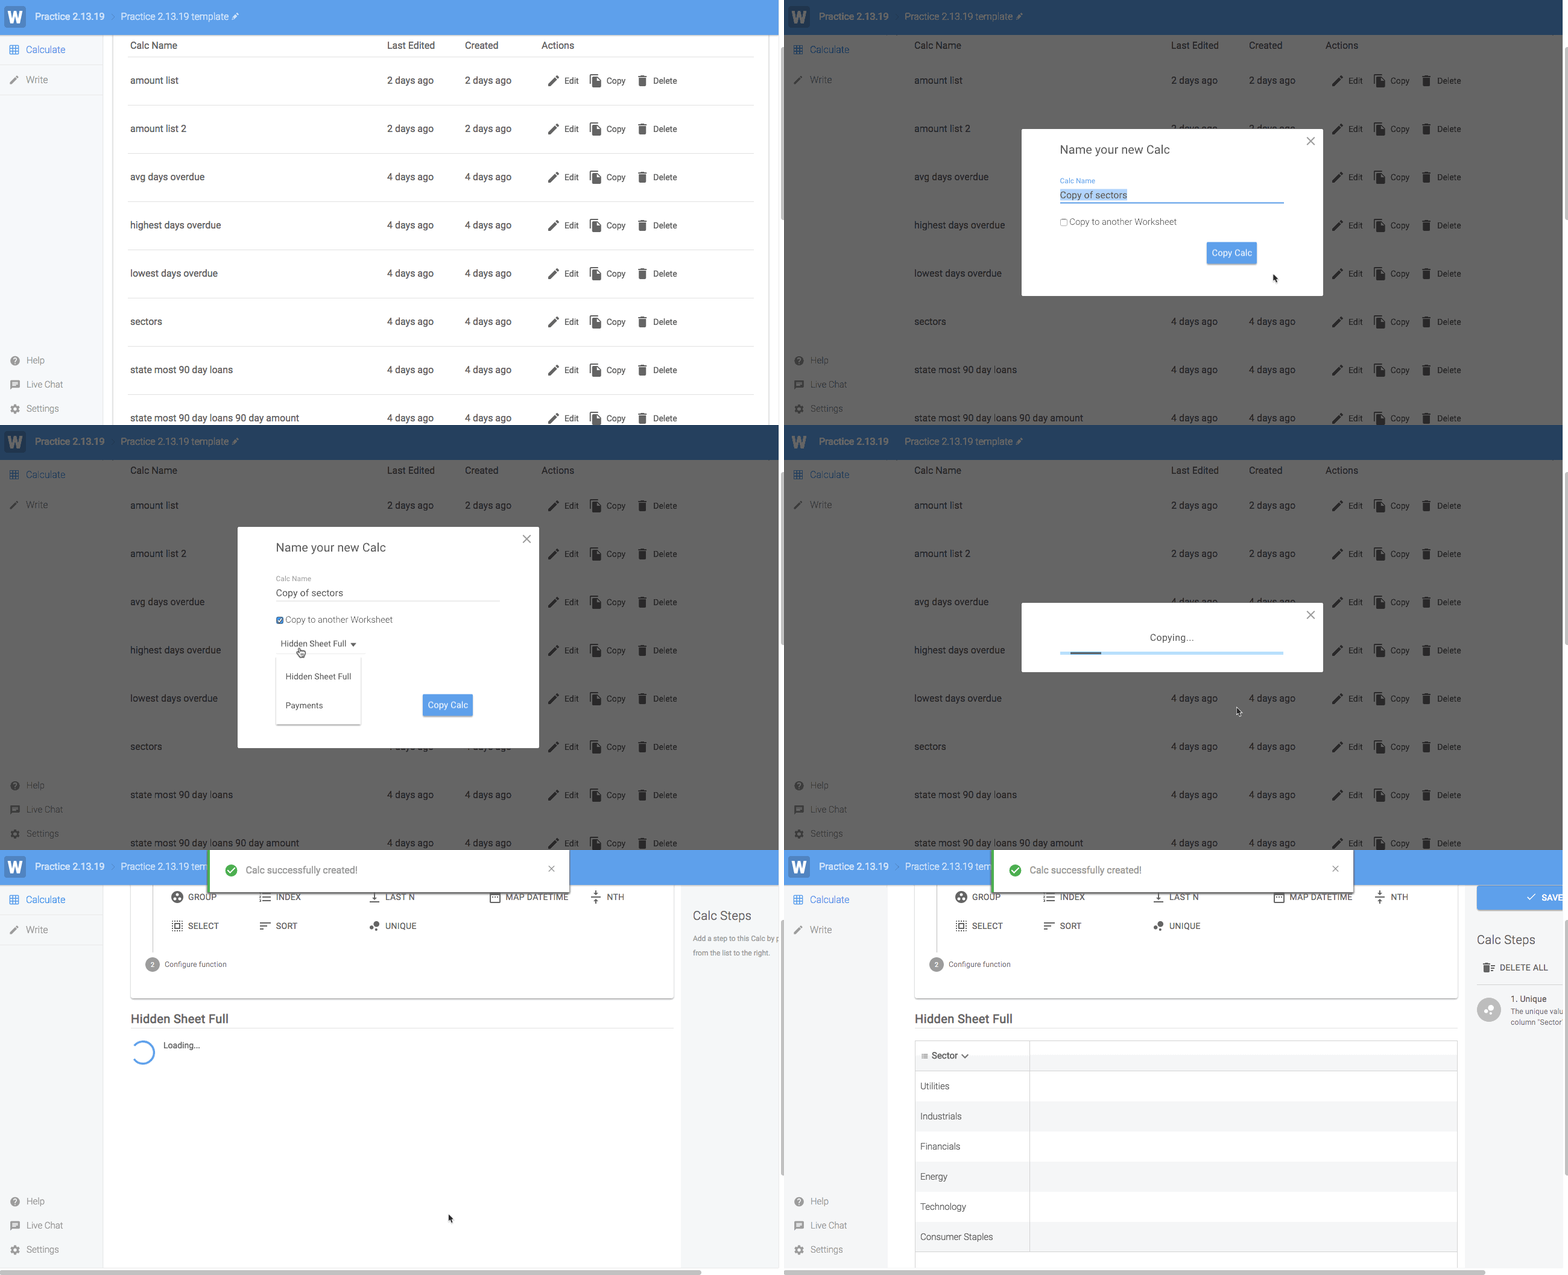
Delete Calcs
You can delete any calcs, but make sure you aren't using those calcs in another calc. You'll see an error message pop up if you try to delete a calc that's used in another calc.
Create Multiple Data Variables at Once
When you save a calc, the columns in the data table become Data Variables. So if you save a table with multiple columns, you'll create multiple Data Variables. Wordsmith will append the name of each column to the end of the calc name.
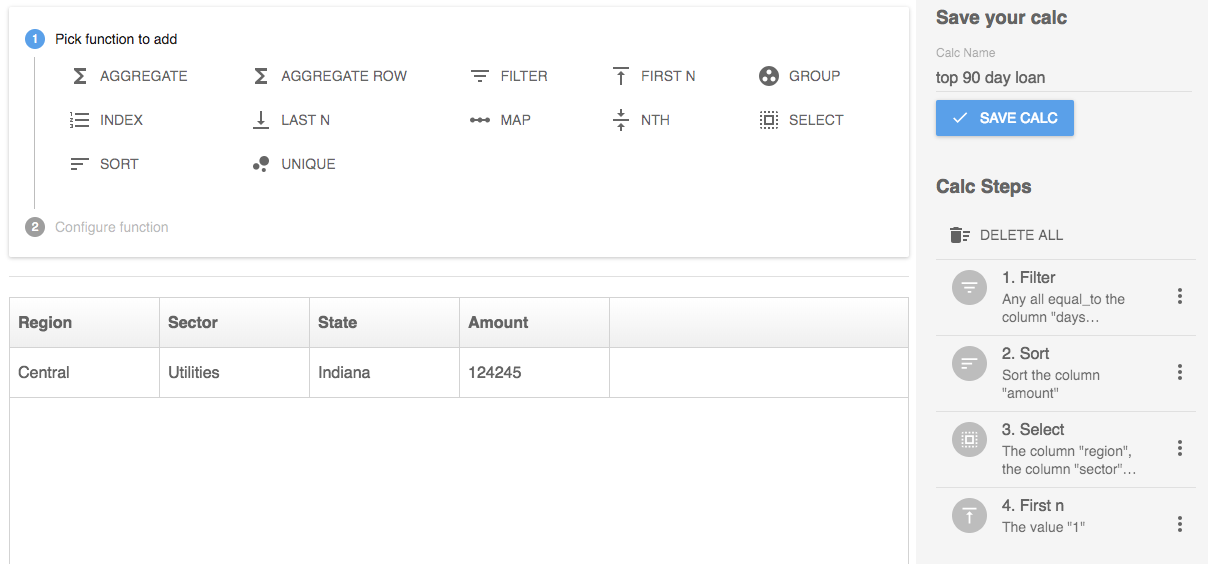
In this example, we have 4 columns in the table for the top loan volume. Saving this calc will create 4 Data Variables: top_90_day_loan_region, top_90_day_loan_sector, top_90_day_loan_state, and top_90_day_loan_amount.
Create a List
Create a list of values by saving a calc that has multiple rows in the table. You'll be creating one Data Variable that will include the value of each row as a comma separated list.
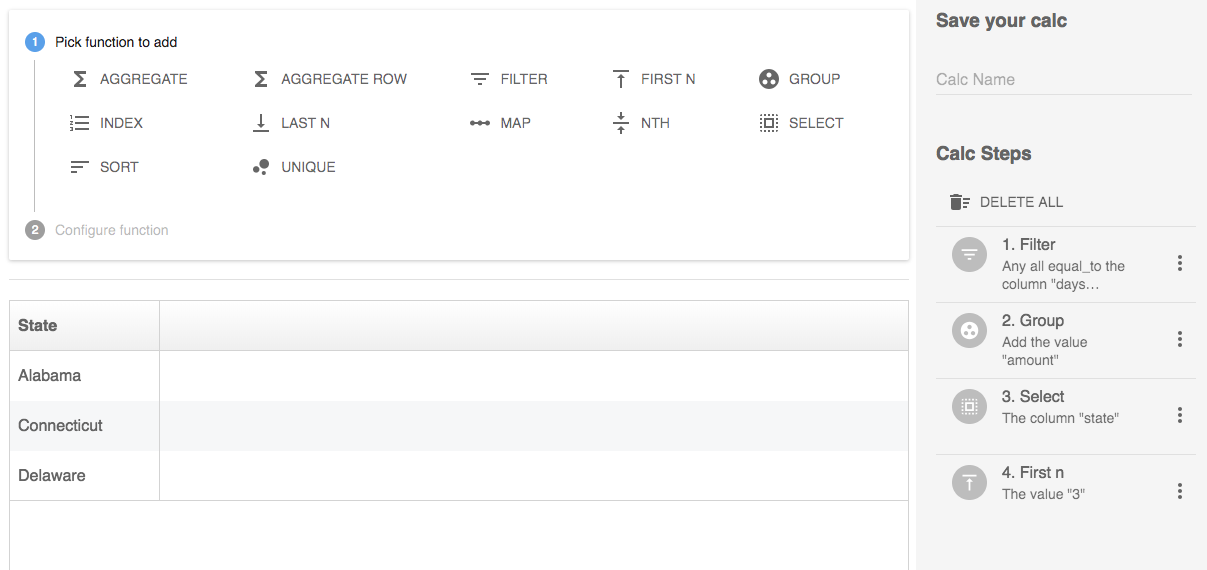
In this example, we've already gotten the table down to the top states by 90-day loans. Saving this calc will create a list of those 3 states that look like this: "Alabama, Connecticut, Delaware".
Use Calcs in other Calcs
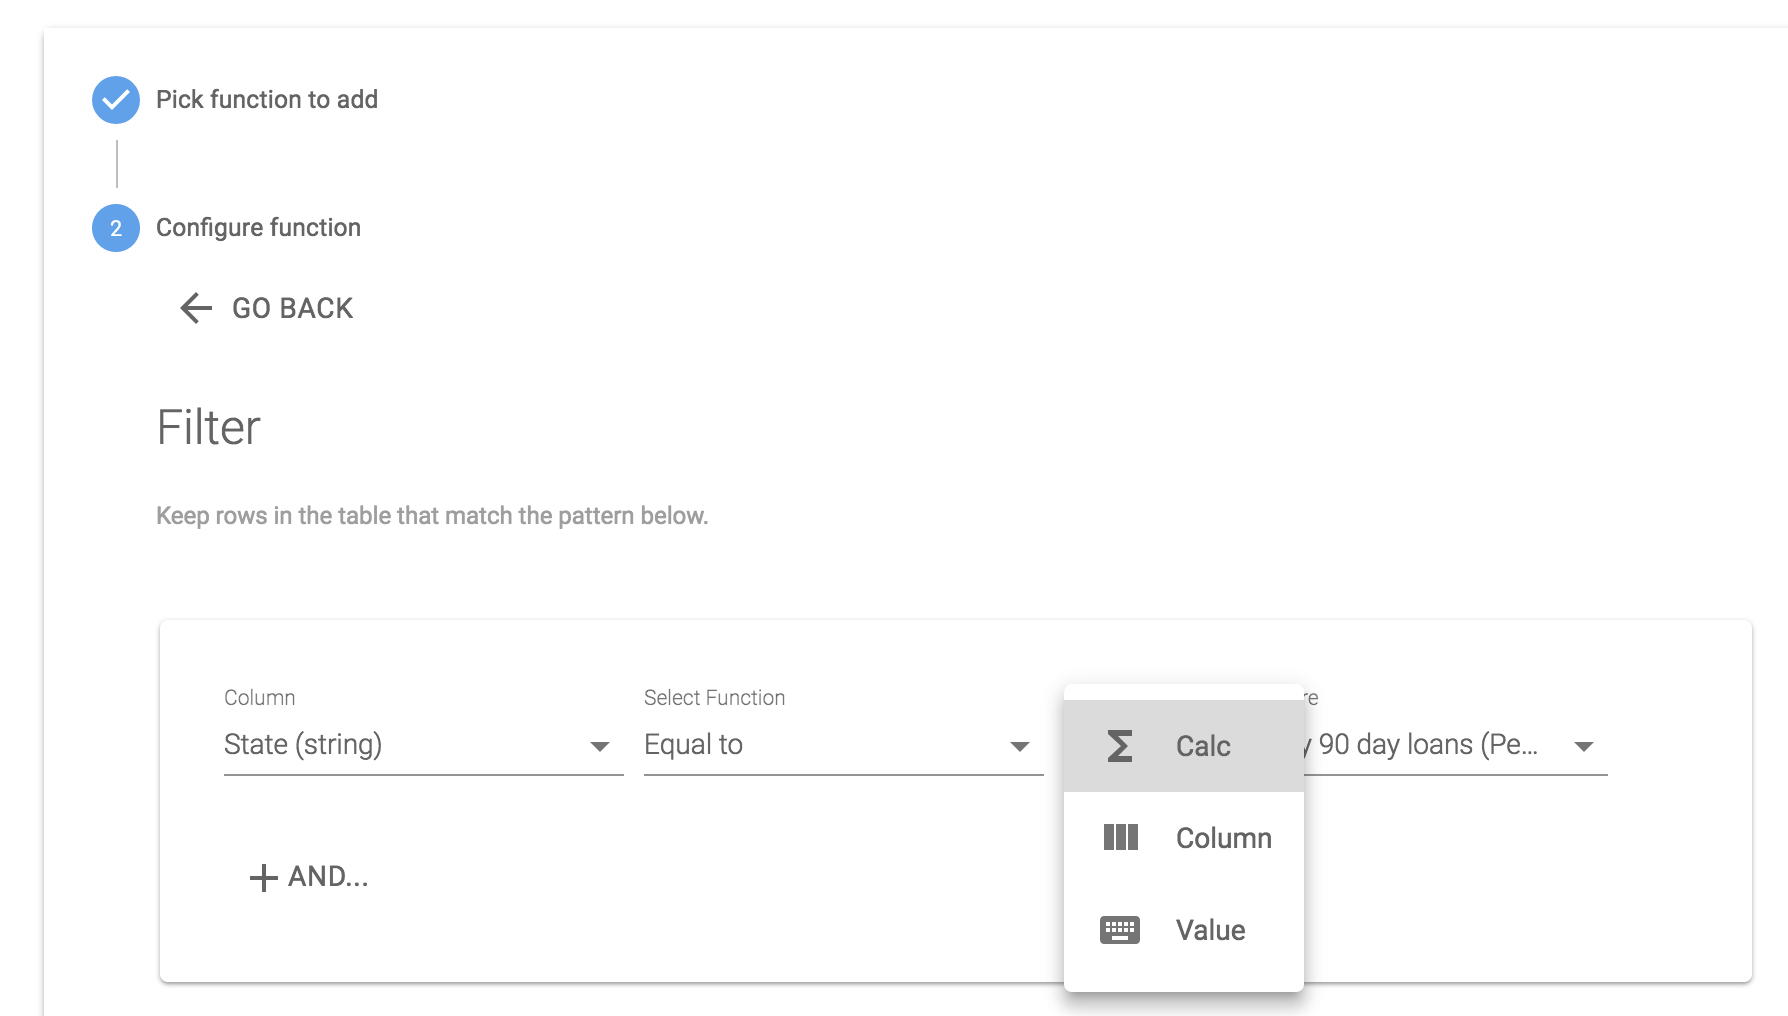
In the Filter, Aggregate, and Index functions, you can use Calcs you've already created. To use a Calc in another calc, adjust the type in the function to "Calc". There are three options in the type setting: "Value" allows you to compare to a static number or text string, "Column" allows you to compare to a column in the data table you're currently building a calc in, and "Calc" allows you to compare to a Calc you've already created. Check out an example of filtering by a Calc to get additional metrics about a Calc you've already created.
Change the Data Type
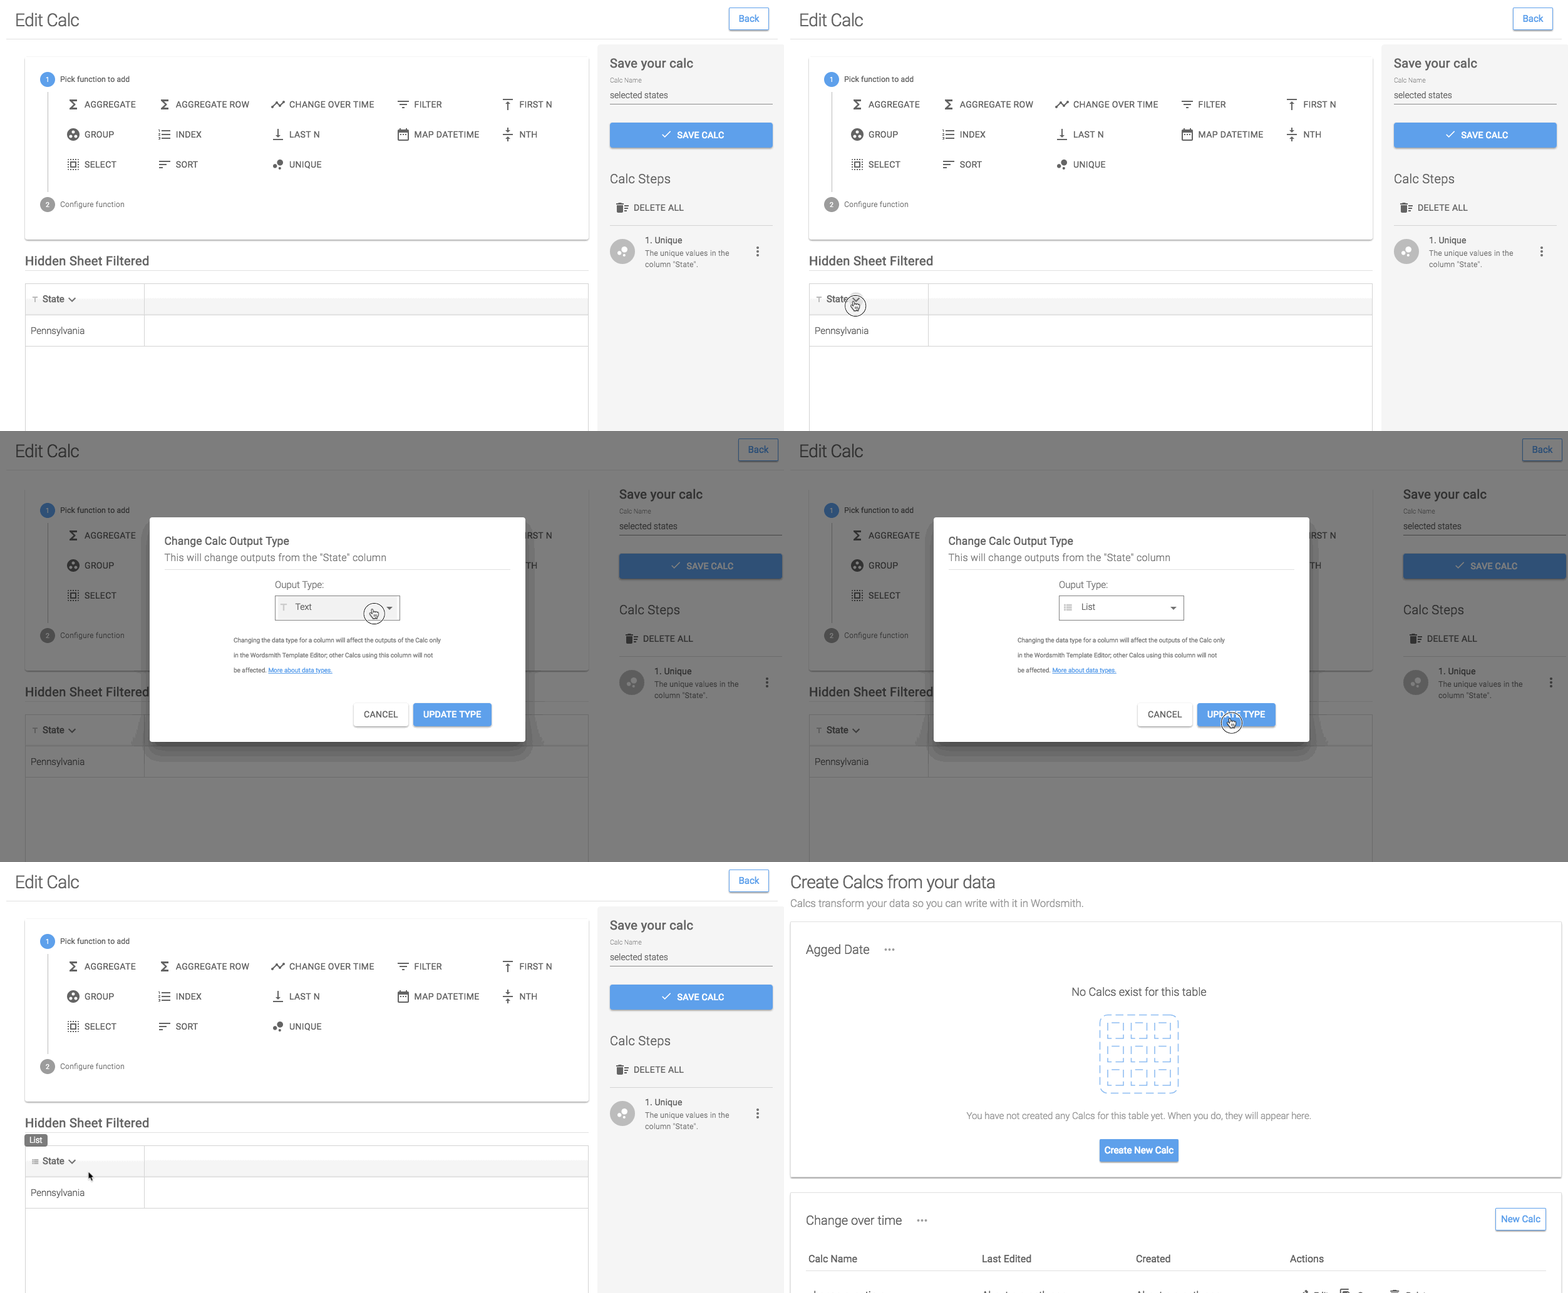
The columns in your table when you save a calc become Data Variables that you can use in your Template. Next to each column, you'll see an icon indicating the data type. If you want to change the data type of your Data Variable, click on the arrow next to the column header and select 'Change calc output type'. You'll see a drop-down of all the data types. Changing the data type will change the formatting options you see when inserting that Data Variable into your Template and the operators you can use in your Branches.
Functions
Aggregate
Aggregate allows you to roll up rows in a table to one single value. You can choose the column you want to aggregate and the math you want to perform on all the rows of data in that column to return one value. And you can aggregate multiple columns at once. Only the column or columns you choose to aggregate will be left in the table after this calculation, all other columns will be removed. Give the aggregated column a custom name or Wordsmith will append the method to the end of the original column name (Amount_add would be written if the rows in the column 'Amount' were all added together to create one new value).
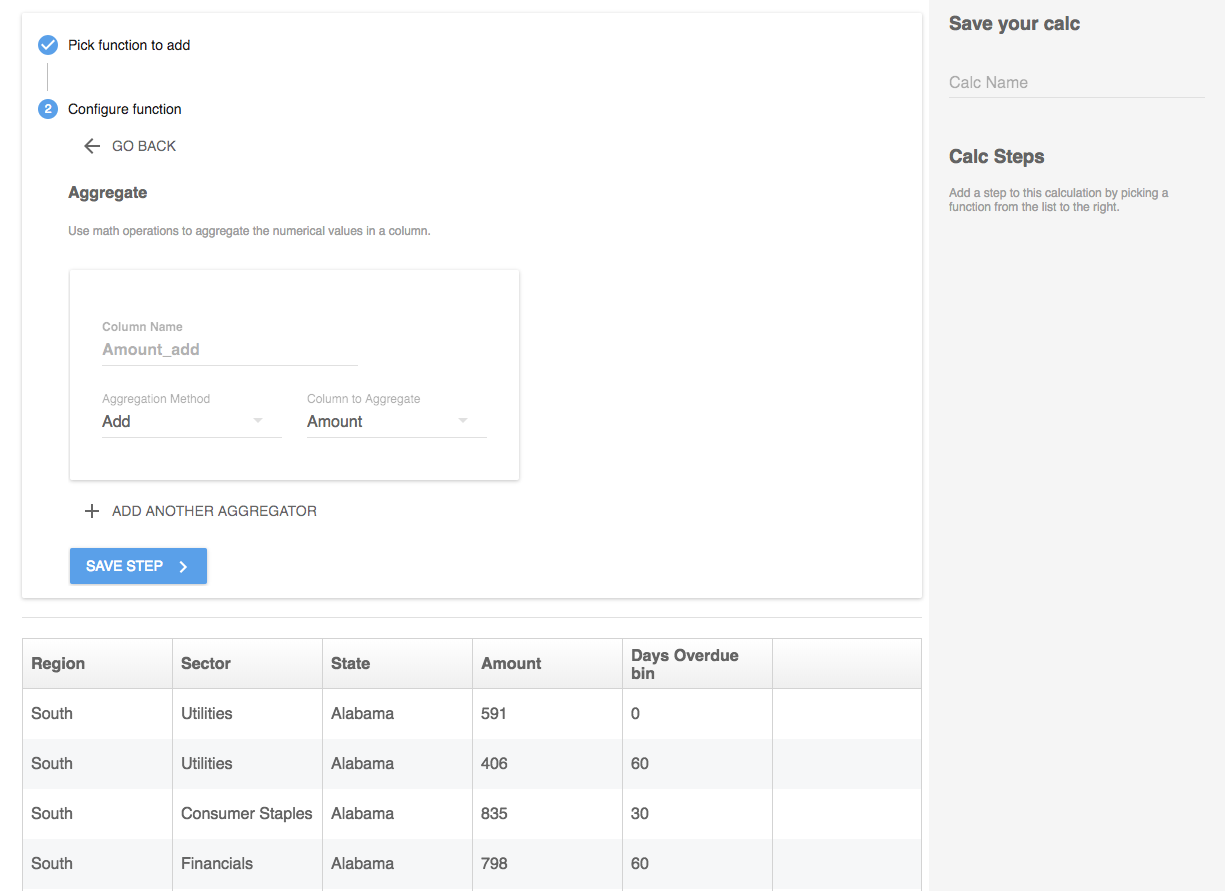
In this example, we want to sum up the amounts for all of the rows to get one total amount. We'll use the Aggregate function to perform the Add method on the Amount column.
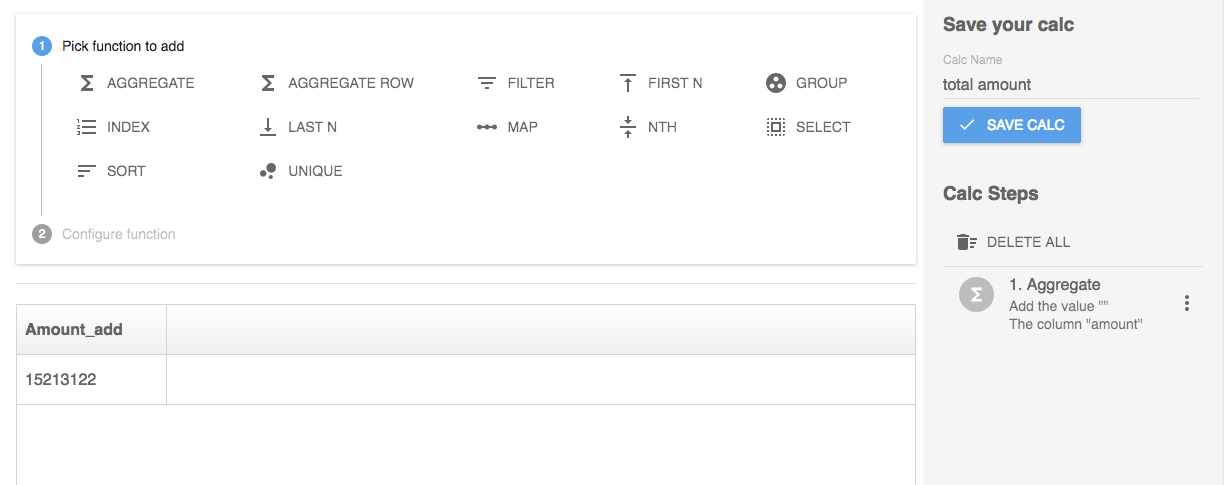
After adding up all of the rows in the table, we'll get one total Amount.
Aggregate Row
Aggregating across a row in the table will allow you to do math on columns to add a new column to the table. You can do things like adding up the values in two columns to create a third summed column. You'll see all the methods you can perform on the columns (those are the math operations). And you can create multiple columns in the same step by selecting "Add another aggregator" at the bottom of the function.
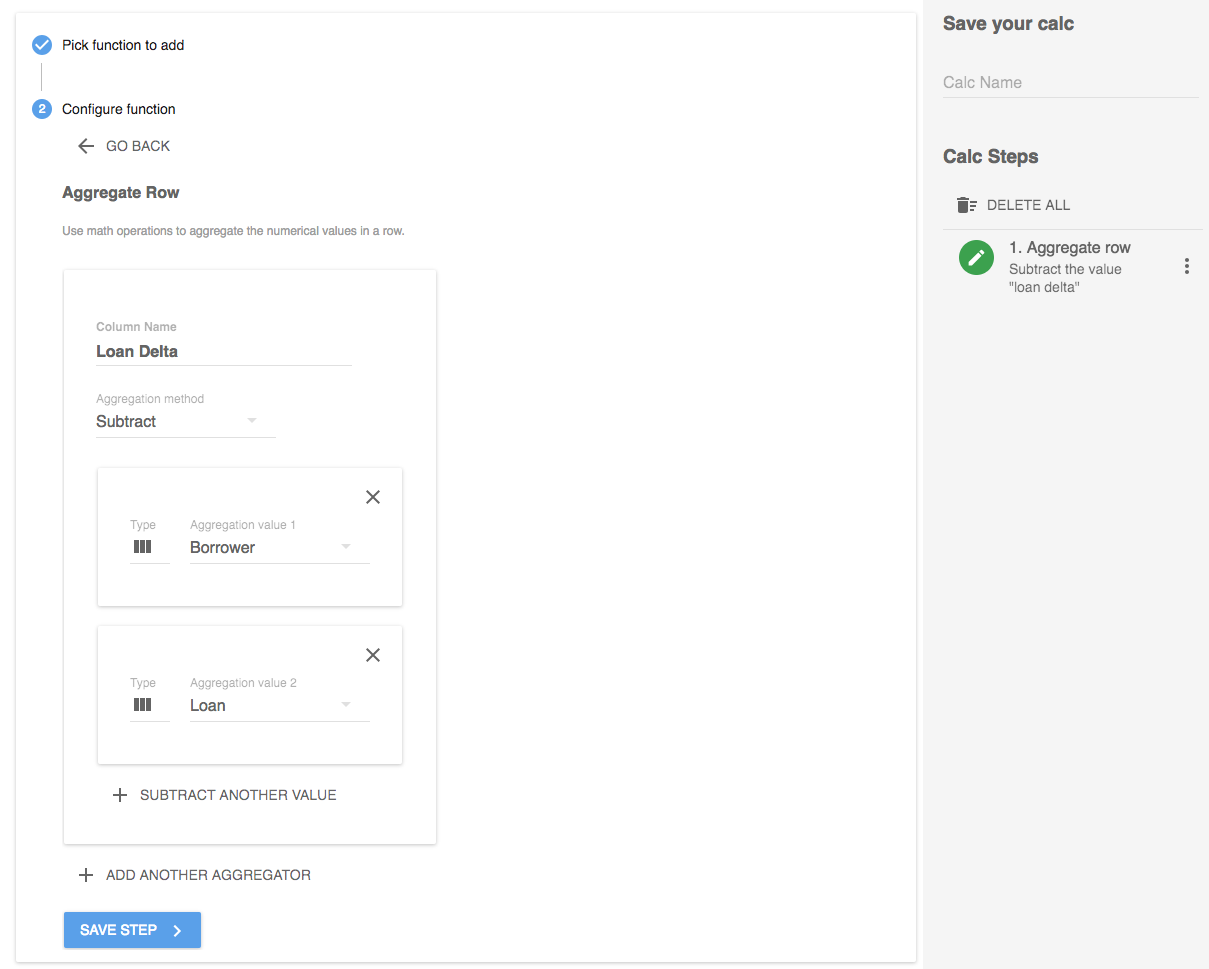
In this example, we want to add a new column to the table that will calculate the difference between the Borrower value and Loan value.
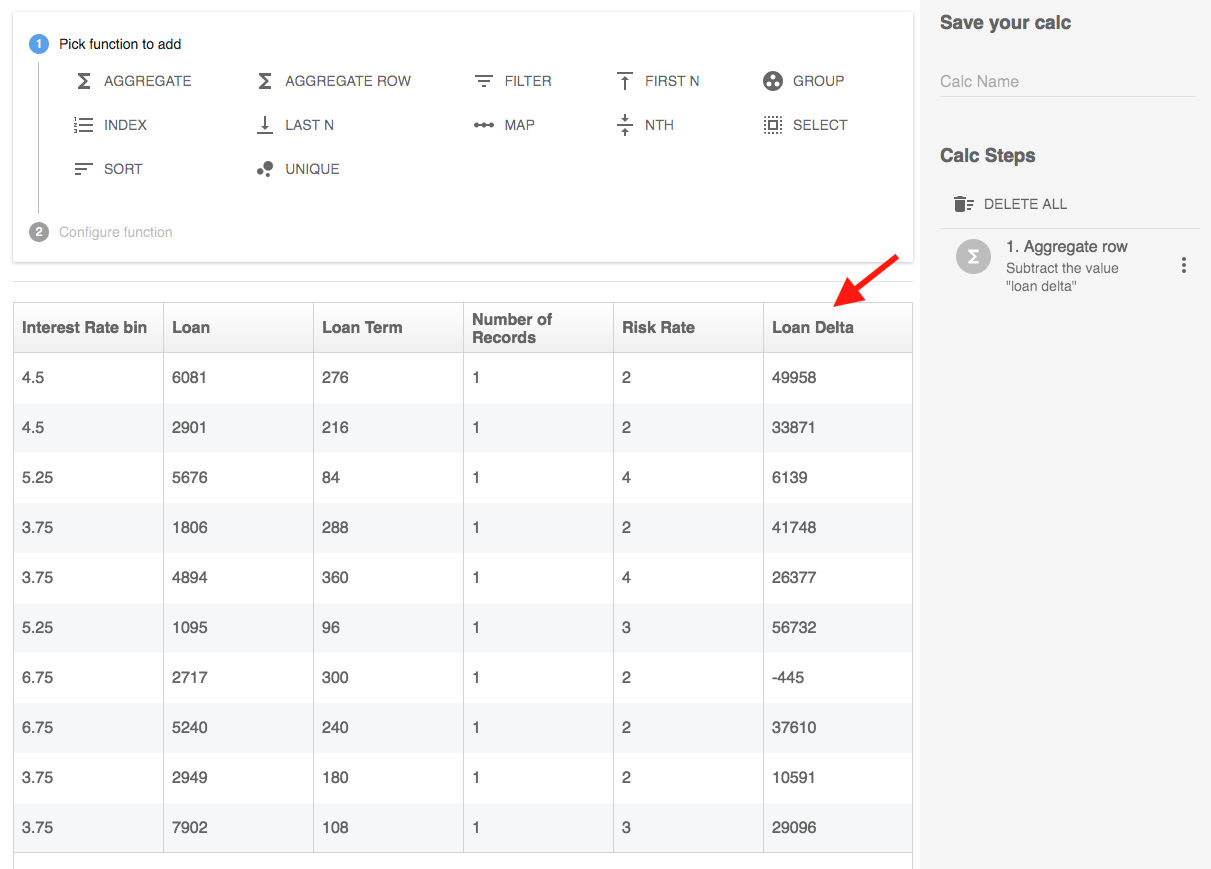
A new column is added to the table for the difference between Borrower and Loan for every row in the table.
Change Over Time
Change Over Time allows you to parse data by time period and set a comparison window to compare the most recent period to the previous time period or the same period the previous year. To use it, you'll need to have a date column in your worksheet. If you don't see data you think is a date, check the underlying data in Tableau by going to Analysis>>View Data. If the date data is aggregated to the year, quarter, or month in Tableau, it won't be recognized as a date in Wordsmith. You'll need to convert the date to the Day setting in Tableau and make it discrete.
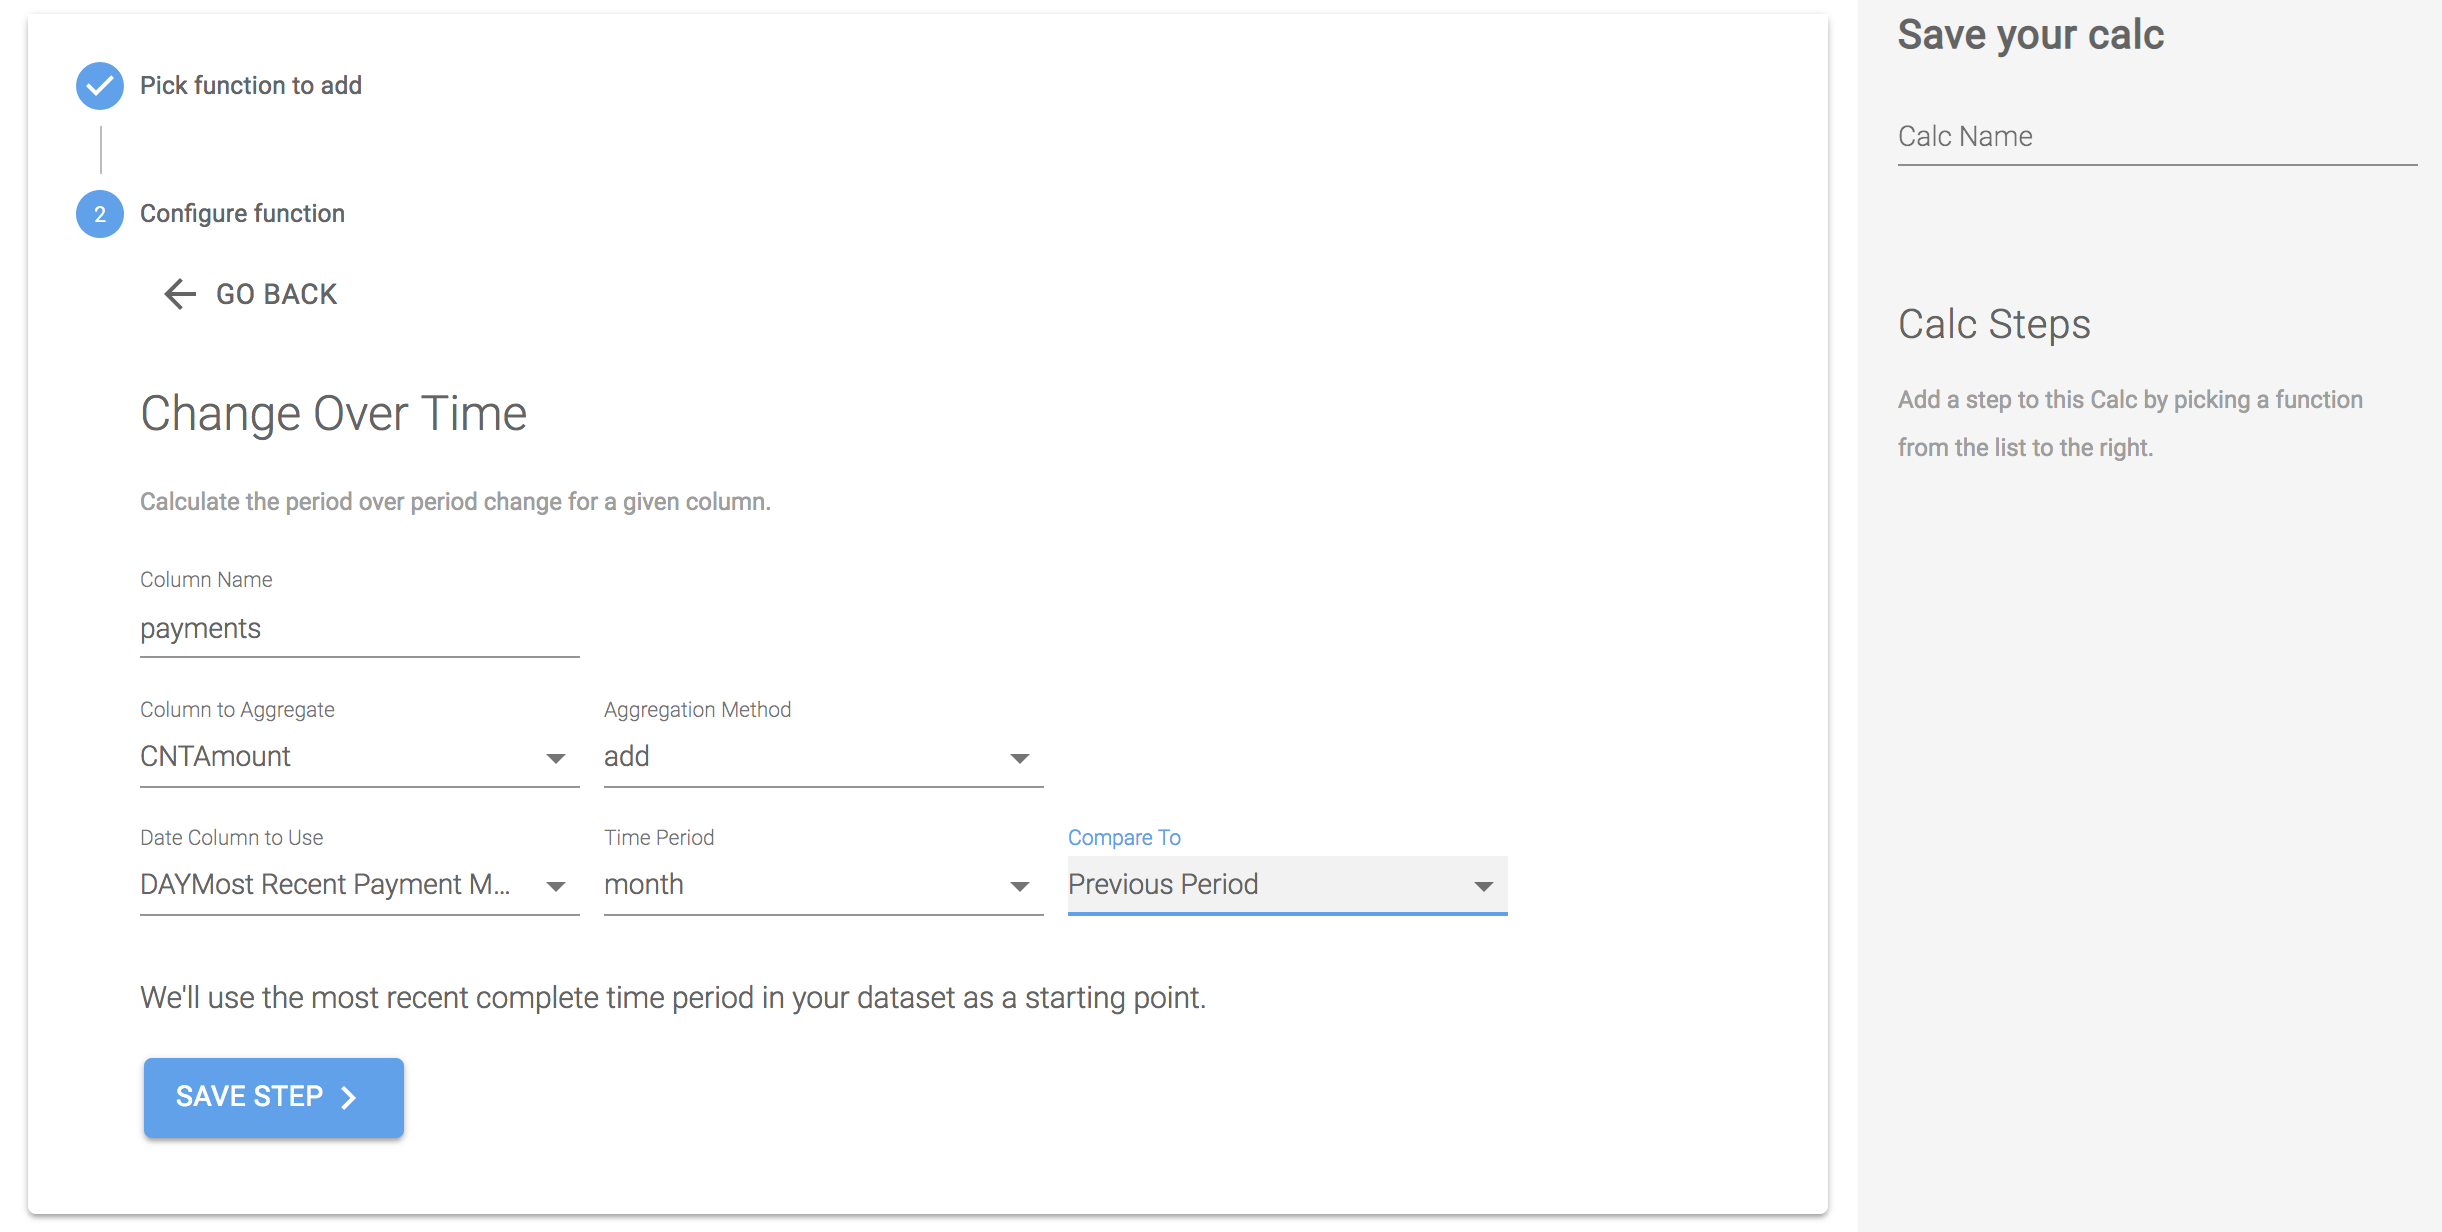
In this example, we want to compare the number of payments from the current month to the previous month.
Column Name is the root name that will be given to all the new columns you create with this function. You can edit this or use the helper text already there.
Column to Aggregate is the column of data you want to roll up by time period. You'll only see number data in the drop-down.
Aggregation Method is how you want to roll up that column. "Add" is the most common method to use as it will sum up all the values in the column, but "average", "max", "min", and even "count" could also be used.
Date Column to Use is the column with the time period data you want to group by. You'll only see date data in the drop-down.
Time Period is the time period you want to compare. You can select day, month, quarter, or year.
Compare To is where you'll select if you want to compare the most recent period to the previous period or the most recent period to the same period last year.

The result of the Change Over Time function is six new columns in the table: the value of the previous time period, the value of the current time period, the difference between the previous and current time period, the percentage change between them, the previous time period, and the current time period. You can choose to keep whatever columns you want by using the Select function.
Filter
Filter will remove data from the table that you don't need. You'll write the criteria for the data you want to keep, and everything else will be taken out of the table. You can use a combination of "and" and "or" functions to keep only the data you want. You'll select the column you want to filter on, then the function and value for the data to keep within in that column.
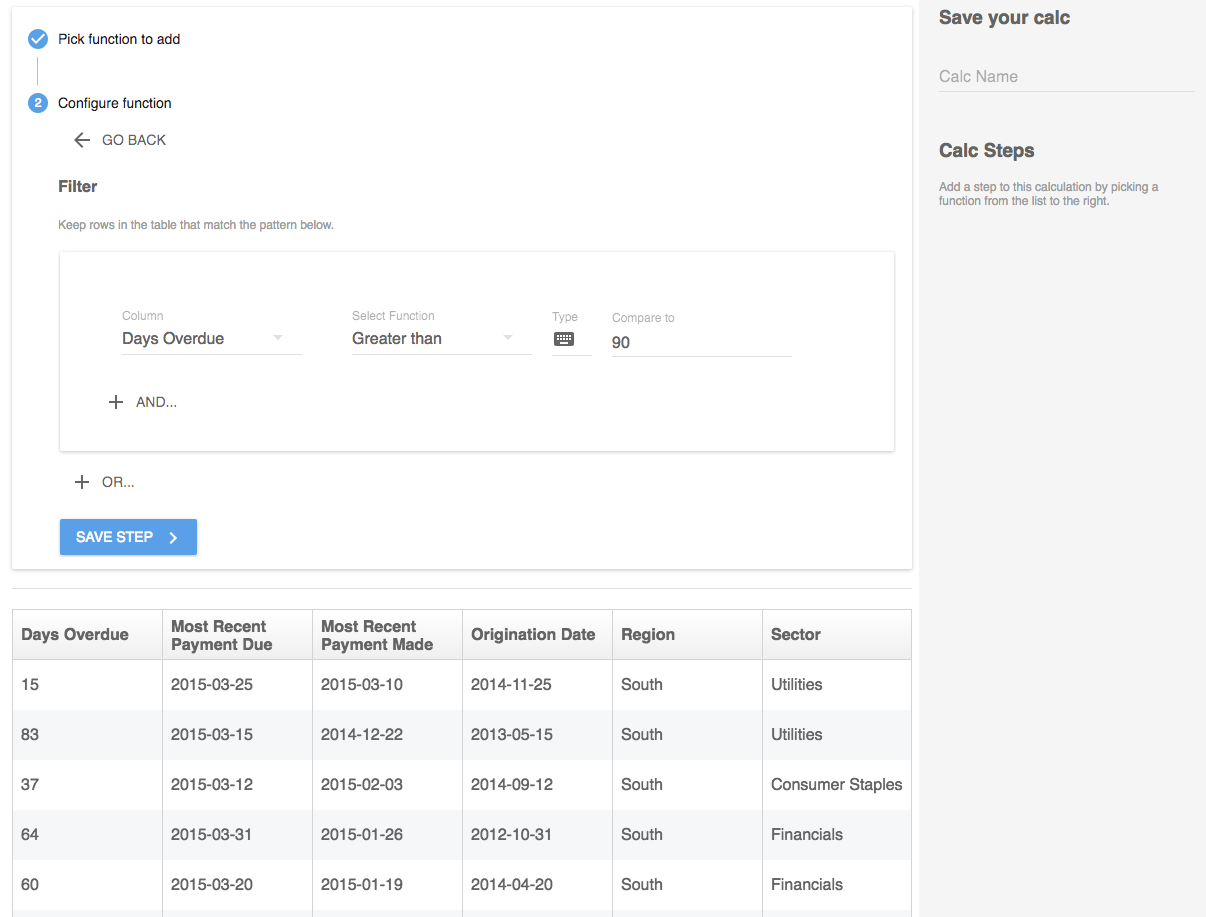
For example, we want to filter out the data for any rows of the table where Days Overdue is greater than 90. We'll select the column Days Overdue, then the function of Greater than and type in the value of 90.
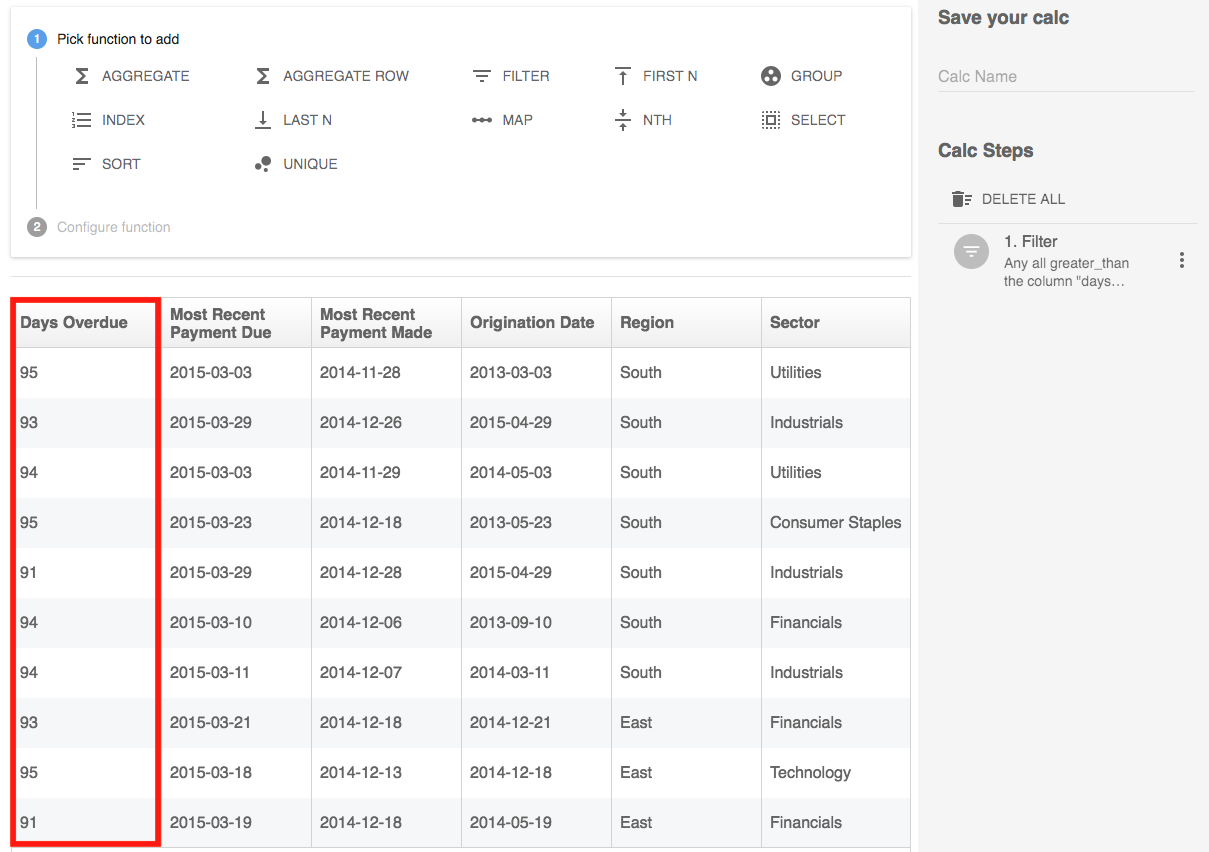
Now we'll only have data in the table for any rows where the Days Overdue value is greater than 90.
The type you select in the Filter is important. You can either filter on a Value, like in the example above, an entire Column, or another Calc. Filtering on another calc you've already created is a powerful way to drill down on a specific insight. You can even use calcs from other tables.
For example, we've already created a calc for the state that had the highest total volume of loans. Filtering this table by that calc allows us to create a new calc just for that particular state, like the amount of loans that exceeded 90 days. So we can write an insight like this:
With $913,187, New York has the highest volume of loans, but only $147,997 are more than 90 days overdue.
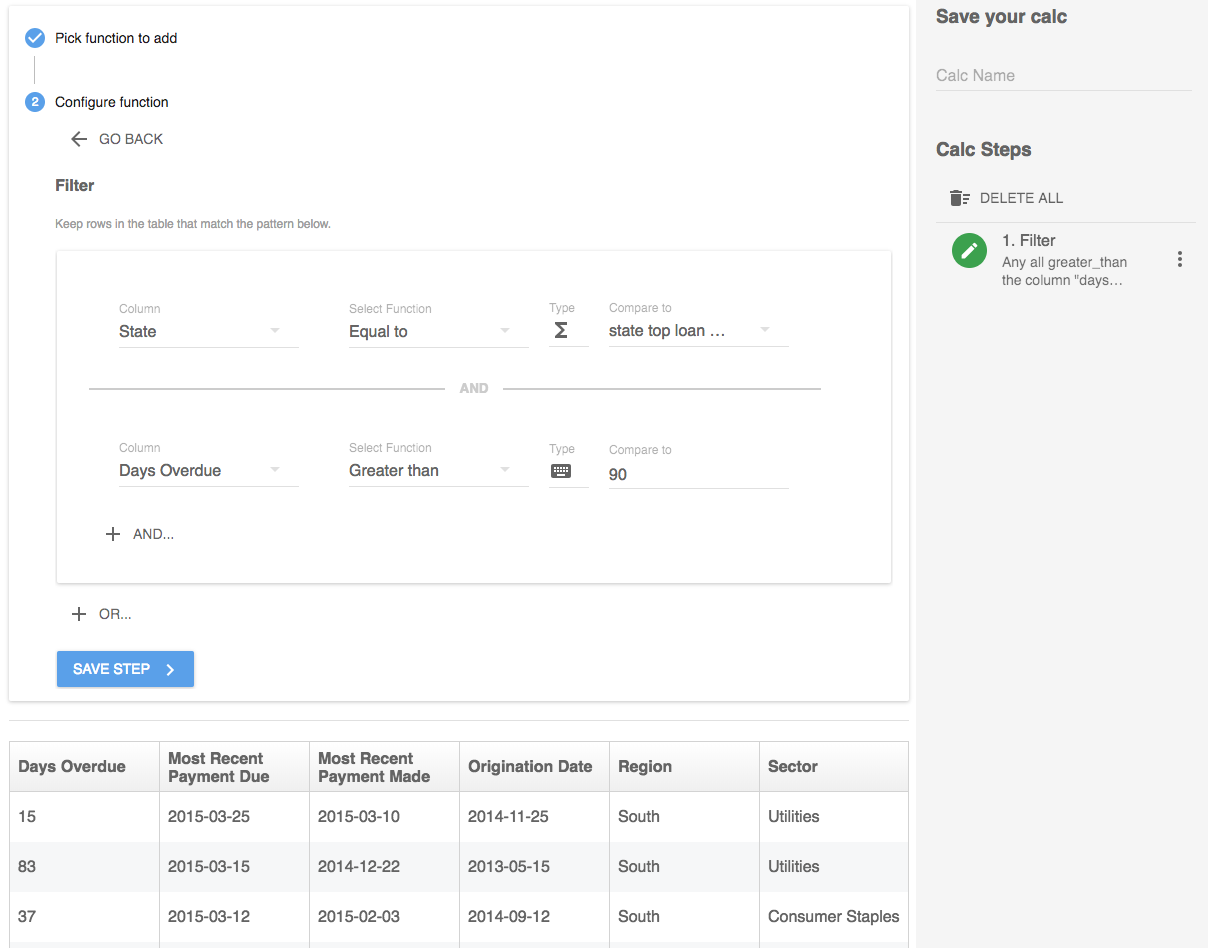
First we'll filter the State column to only include data if the state is equal to the calc we've already written (which is calculating the highest total volume of loans). And we'll filter the Days Overdue column to only include data that is greater than 90.
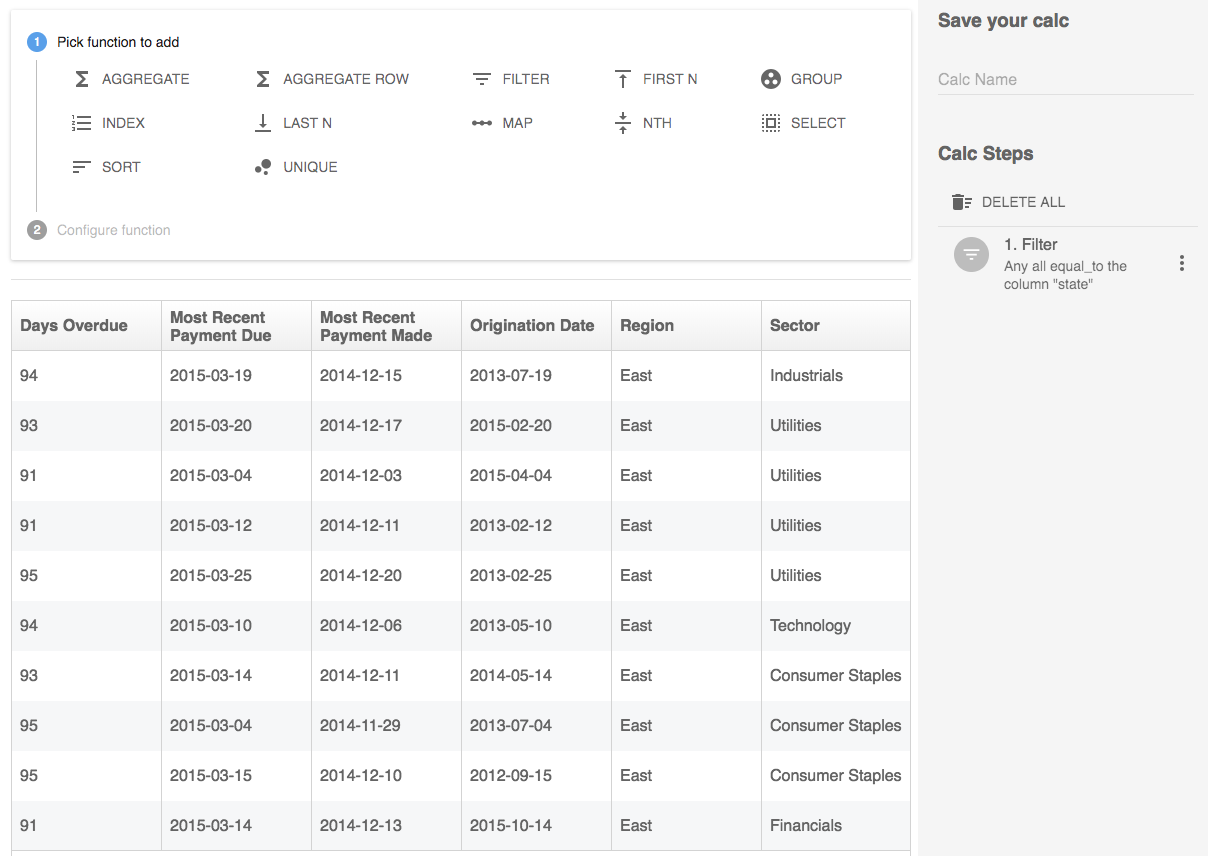
Now we just have data for the state with the highest volume of loans (a different calc) that are over 90 days. So we can keep moving on in our calc to get to the amount of loans that were 90 days overdue.
You can use "and" like in the previous example to filter the data in multiple ways. And you can also use "or" to keep data that meets either requirement you set.
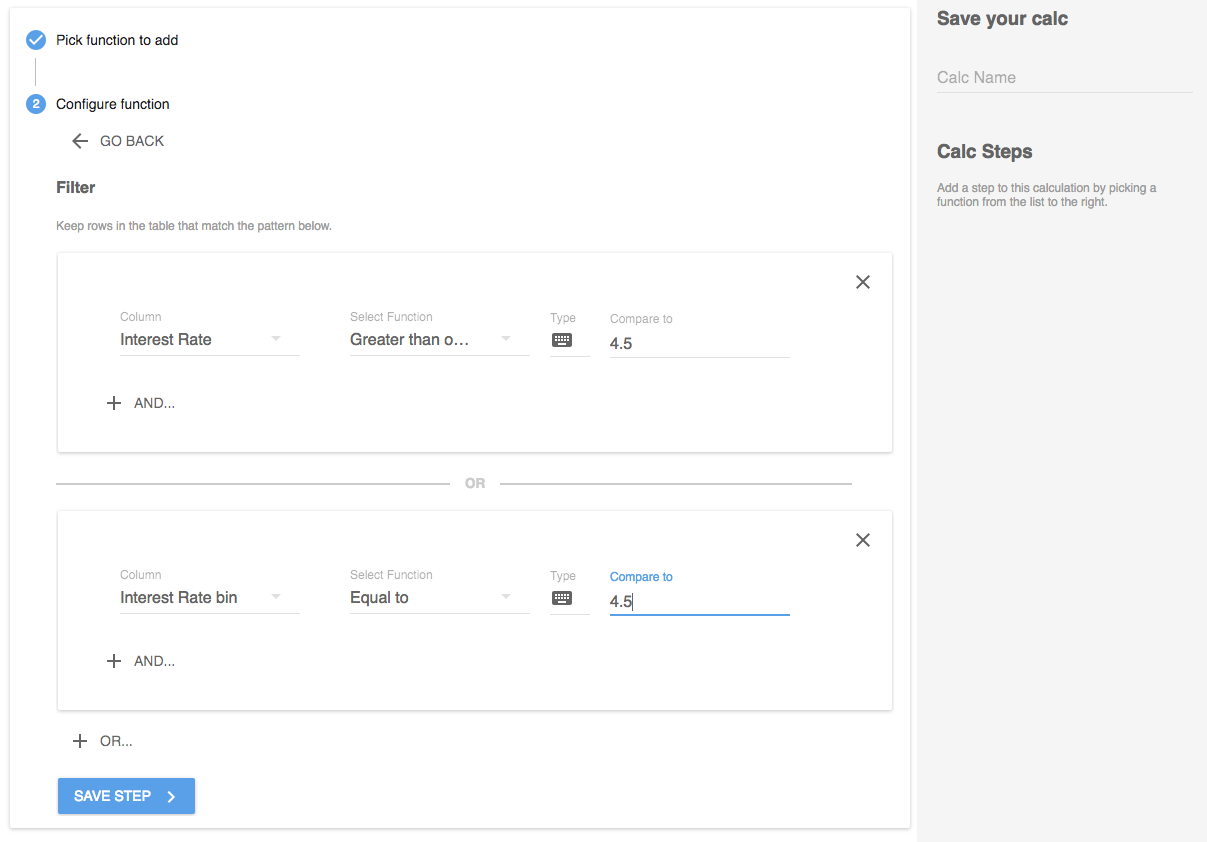
In this example, we want to keep data that either has an Interest Rate that is greater than or equal to 4.5 or an Interest Rate bin that is equal to 4.5 since these are effectively the same thing. This can help if we have missing data and can't rely on one column.
First N
First N will keep a certain number of rows from the top of the table. You'll likely wan to use it in conjunction with Sort so that you either have the top rows or bottom rows.
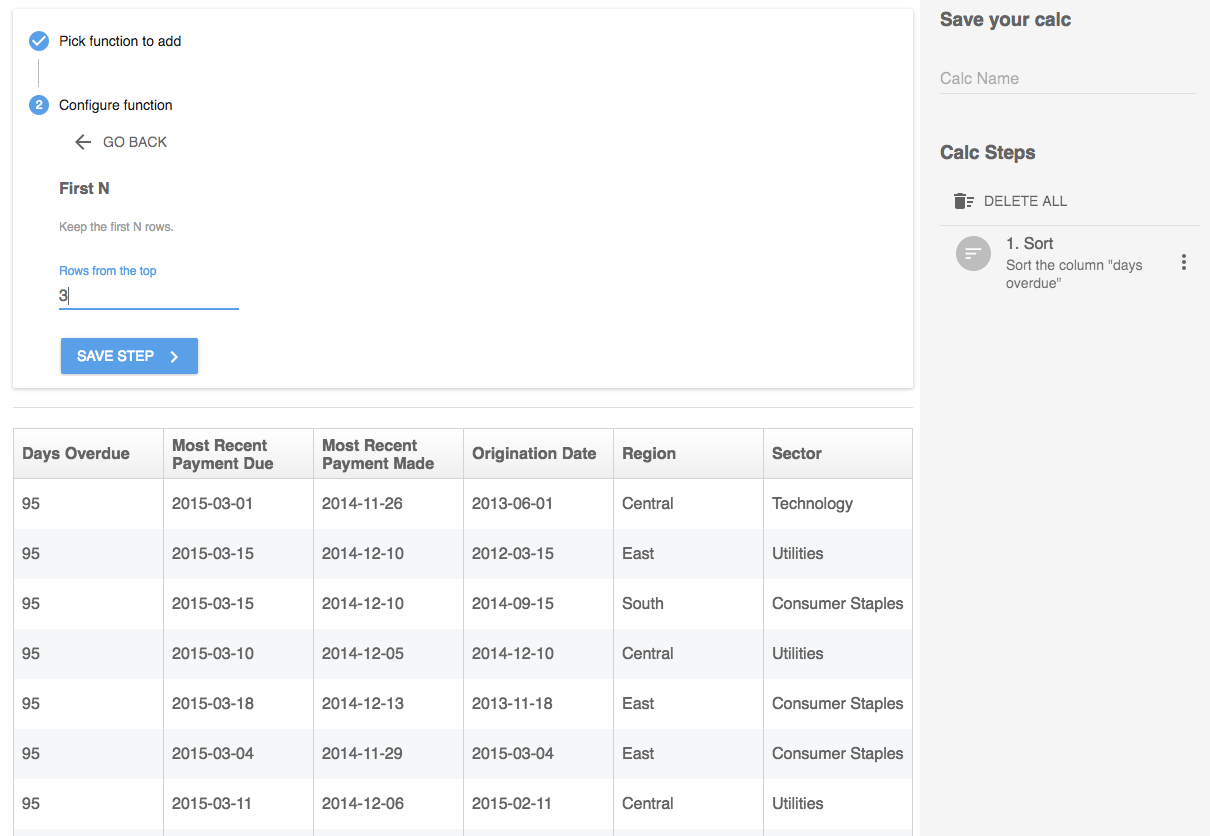
In this example, we've already sorted the table by Days Overdue descending and Amount descending, so we know that the top rows have the oldest loans with the highest amounts.We can set First N to 3 to see the top 3 rows of the table.
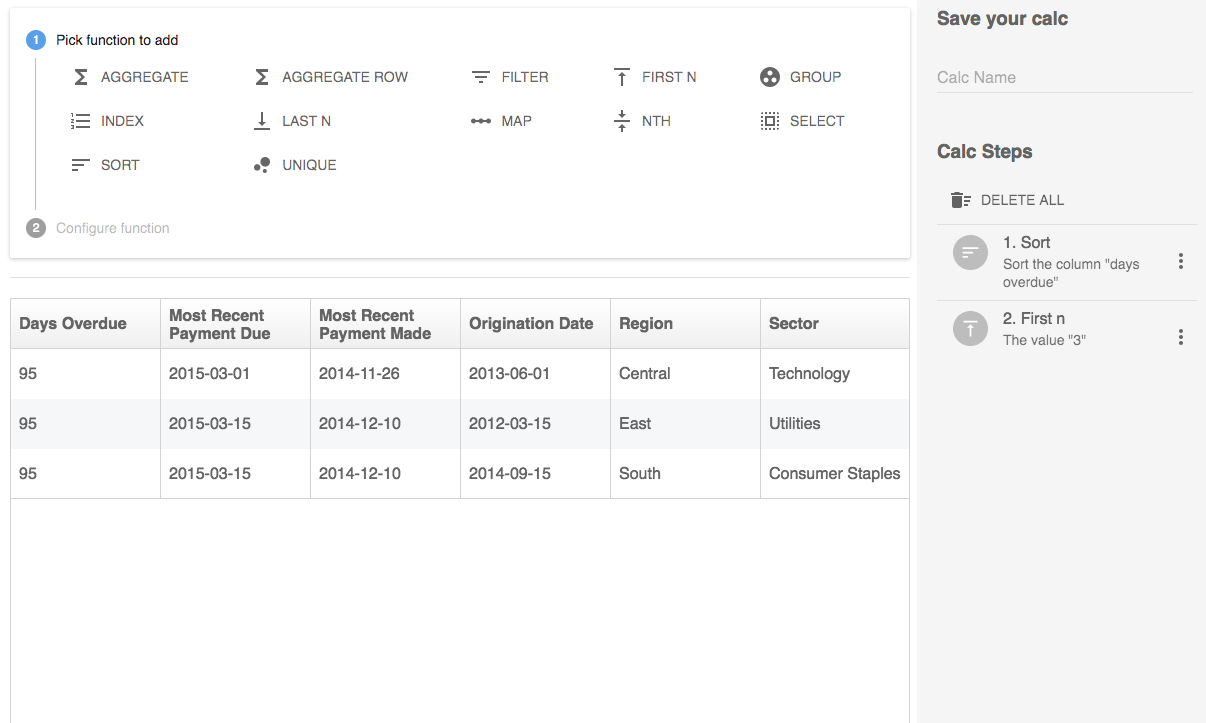
Now we can keep just the first 3 rows to see only the top 3 riskiest loans.
Group
Group allows you to roll up your data into sub-sets. Similar to Aggregate, but instead of reducing your data to one row you can roll it up to different levels of the table. And you can group by multiple columns to get a more granular aggregation of the data. Start by choosing the column you want to group by - every unique value in this column will become its own row in your table. Then choose what columns to keep (Column to Aggregate) and how you want those values rolled up (Aggregation Method). Don't forget, you can aggregate multiple columns.
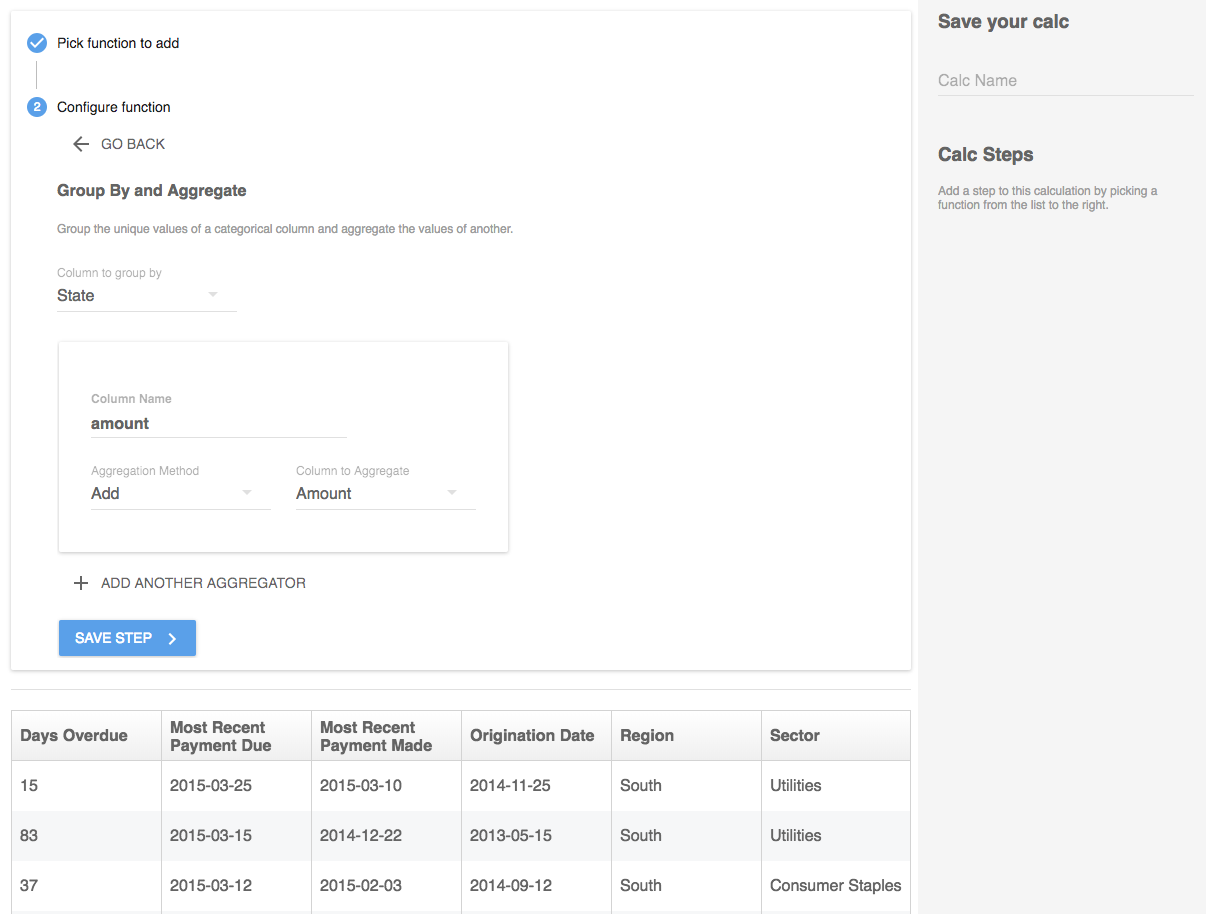
In this example, we want to roll up the total loan amount by state. So we'll group the State column, and add up values in the Amount column.
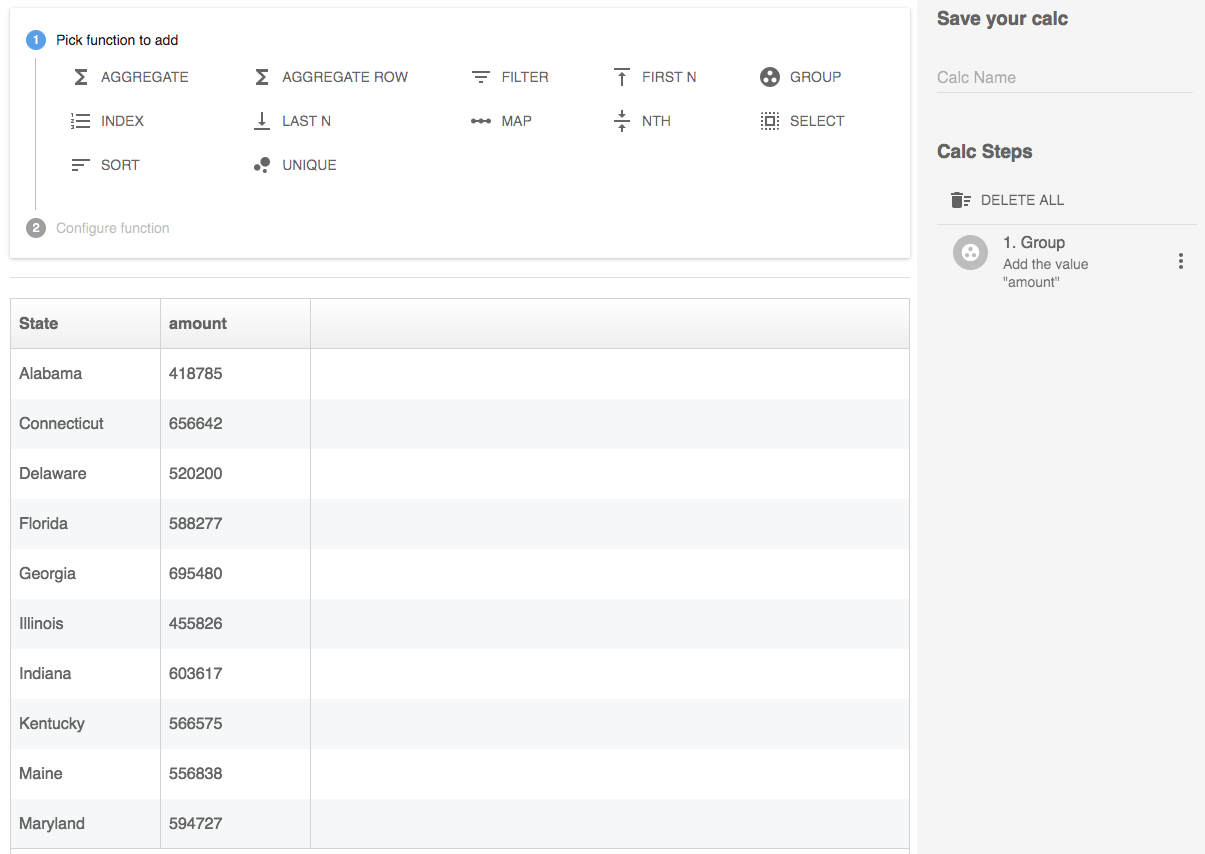
This will give us each unique value in the State column as its own row, with the summed up values from the Amount column.
Index
Index will return the row number from the top of the table for a specific value. You would likely use this after Sorting the table so that the data is in a particular order. Select the column that has the data you're comparing, then set the type to be another "Calc" or a static "Value". Check out an example of using the Index function to get the rank of a Calc in another worksheet.
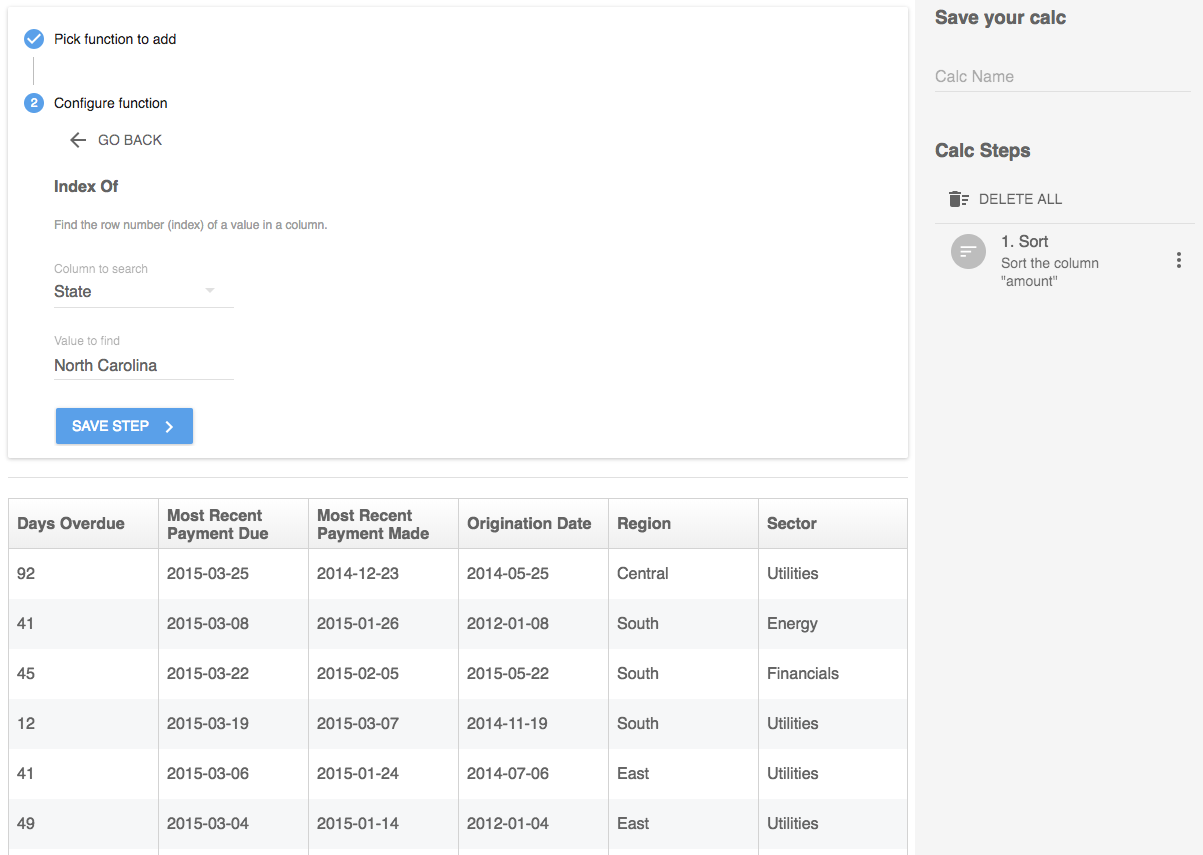
In this example, I want to know what rank a particular state is by total loan amount. The table has been sorted by amount in descending order so the top row has the highest loan volume. First select the State column to search through, then type in the specific state.
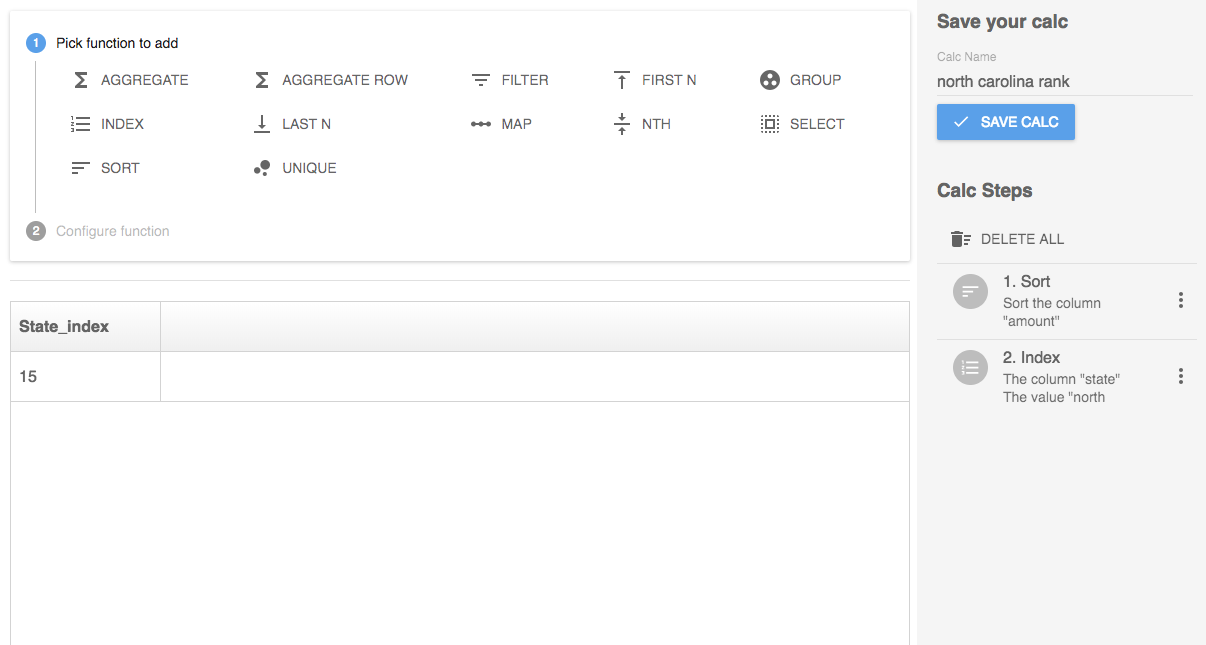
This will give us the row number from the top of the table for North Carolina. So we know that North Carolina has the 15th highest total loan volume.
Last N
Last N is the opposite of First N. It will keep a certain number of rows from the bottom of the table. It's usually used along with Sort.
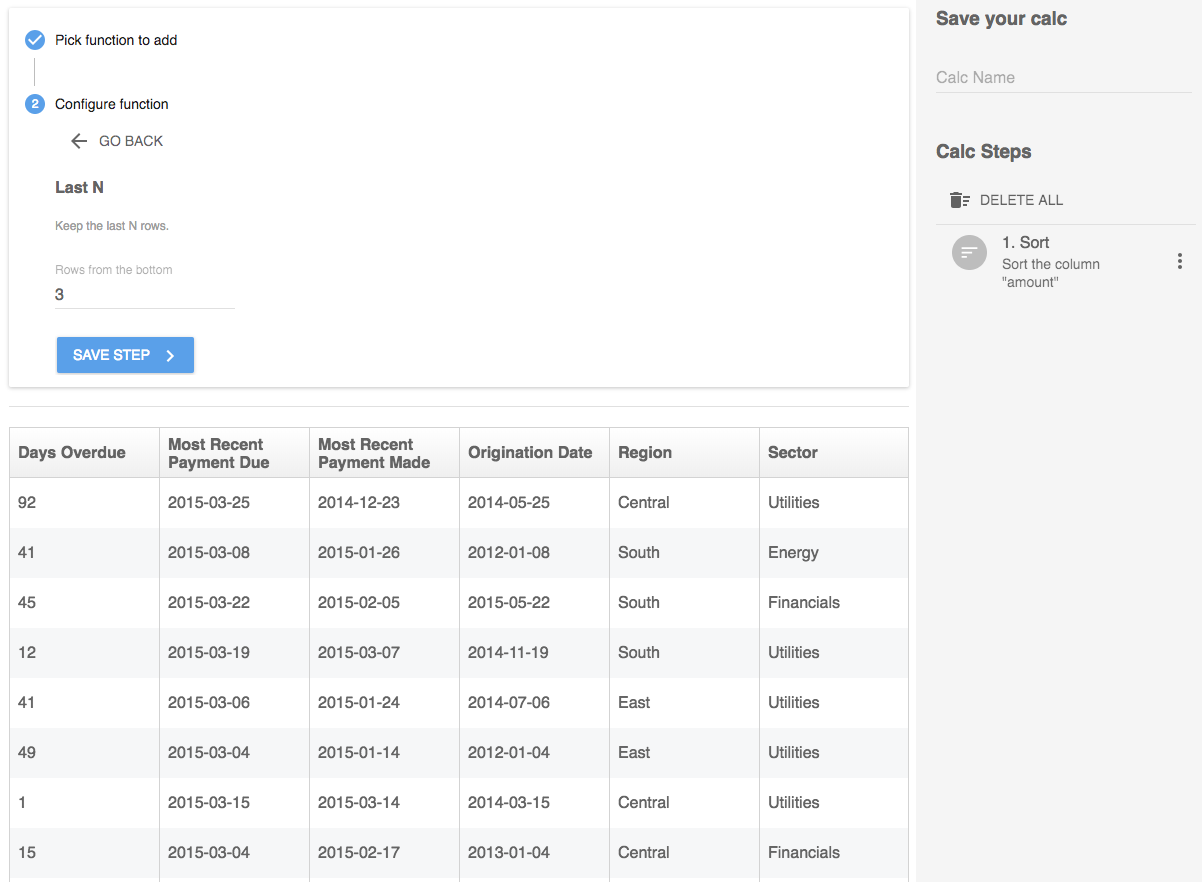
In this example, we'll start with a sorted table where we have the states with the highest loan amounts at the top of the table. To get the bottom 3 rows of the table, we can use Last N = 3.
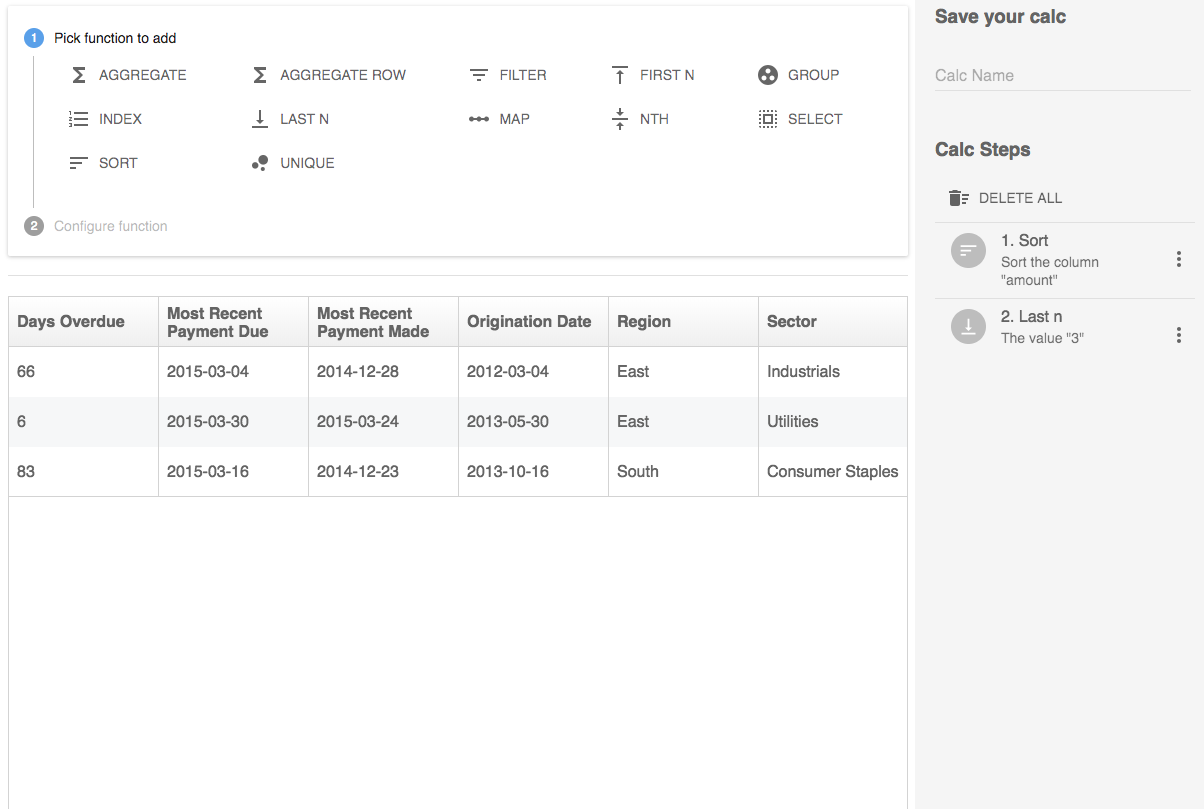
This will give us the 3 states with the lowest total loan amount.
Map DateTime
The Map function allows you to pull out parts of a date or time into a new column in your table. This will only work for date or time data, so if you don't see a column to select it's because you don't have that type of data in your table. You'll select the column you want to use, and the mapper is the part of that data you want pull out - like the hour, month, or year.
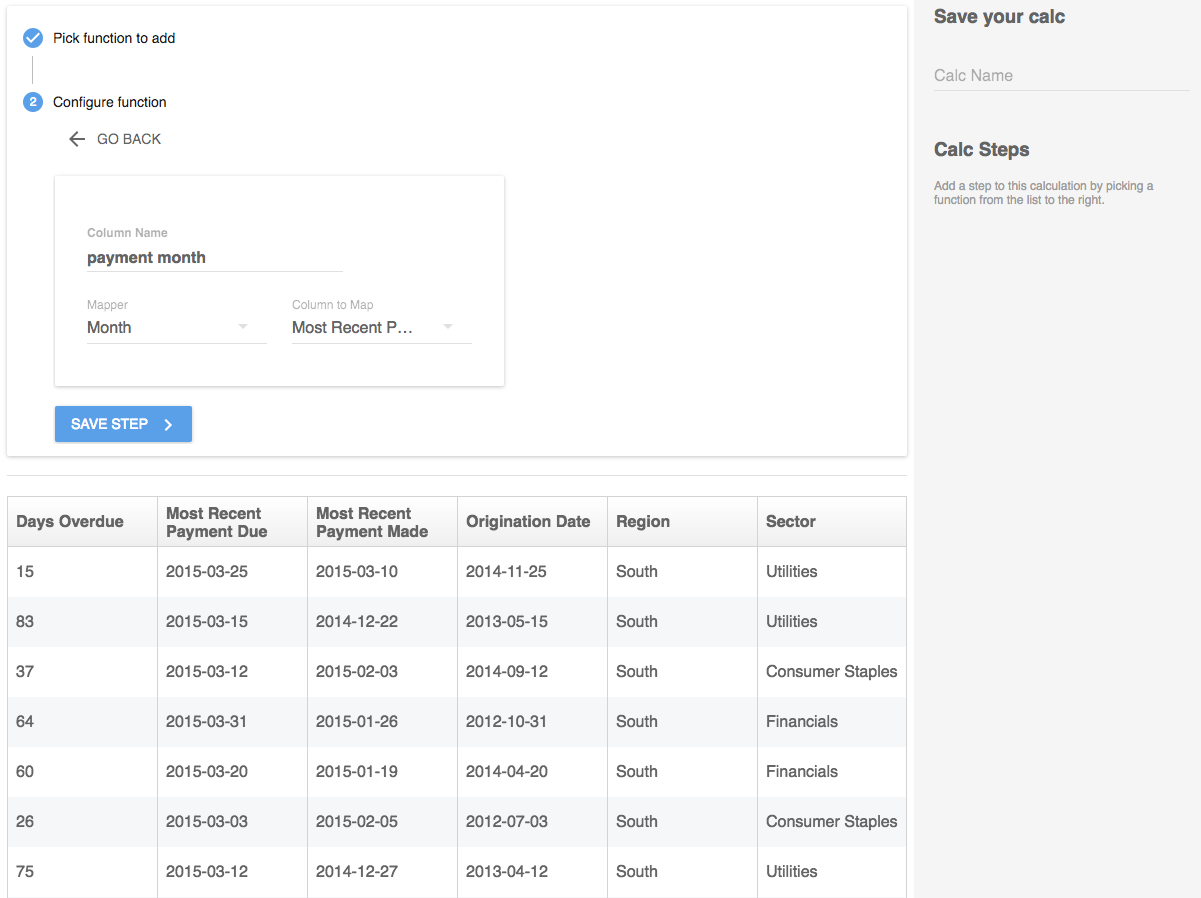
In this example, we want to pull out the month that the last payment was made. We have the date for Most Recent Payment Made in this YYYY-MM-DD format. So we'll select that column, and choose Month for the mapper.
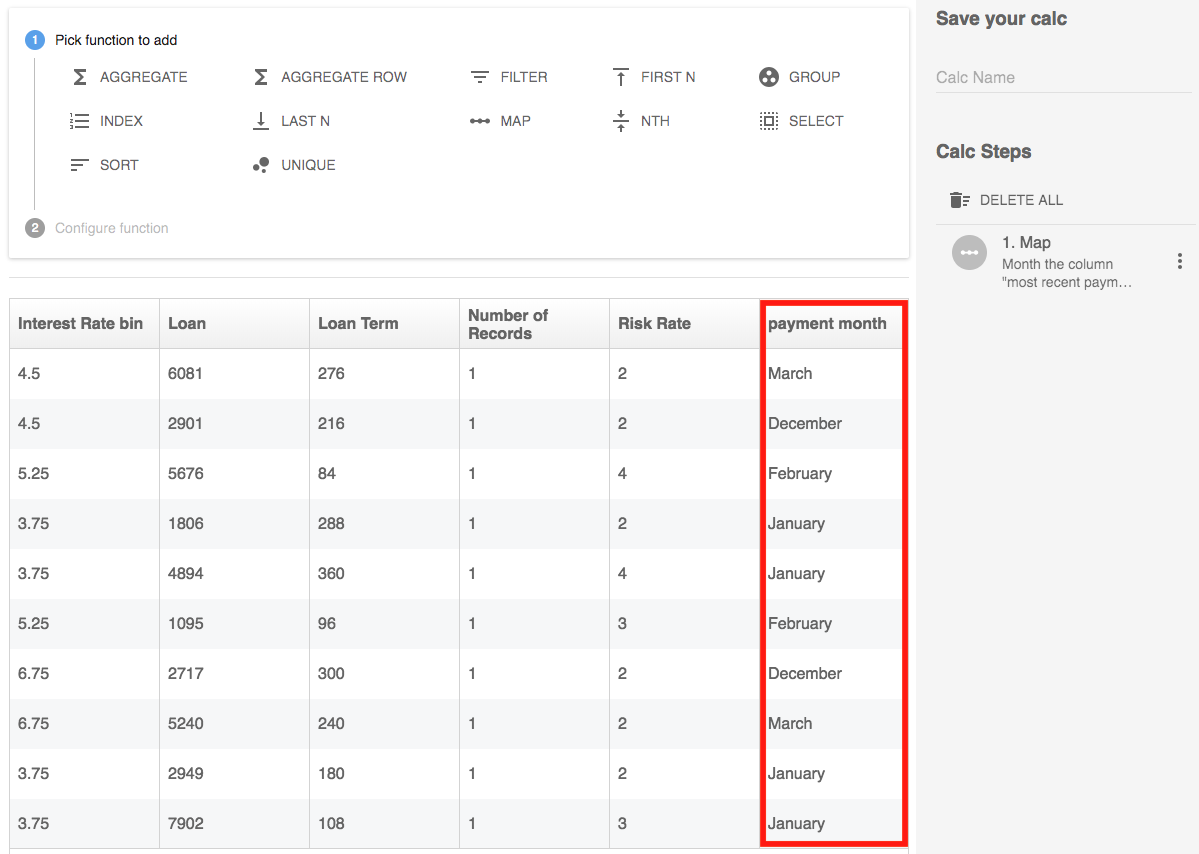
This will give us a new column in the table for just the month from that date in the Most Recent Payment Made column.
Nth
Nth will keep just one specific row of the table. It's usually used after Sorting the table first.
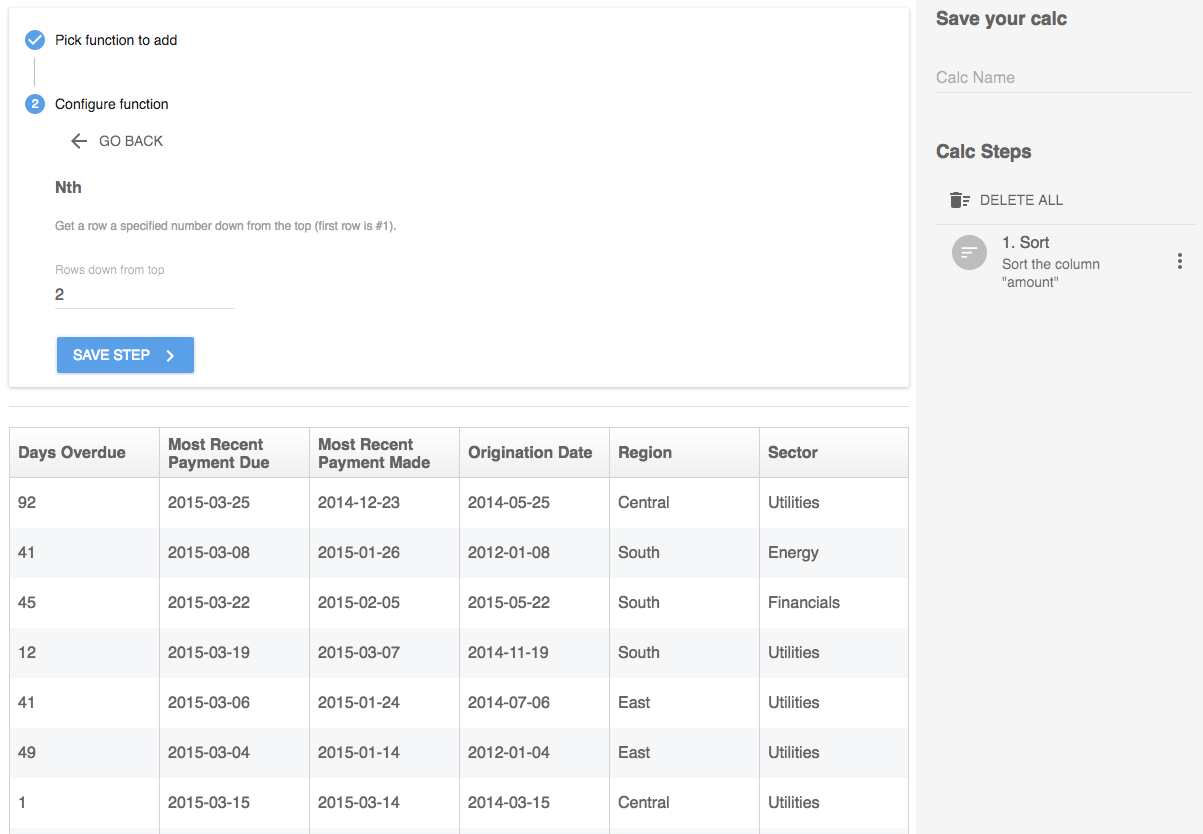
In this example, we'll start with a sorted table where we have the states with the highest loan amounts at the top of the table. I'll get my table down to just the second row from the top, so rows down from top = 2.
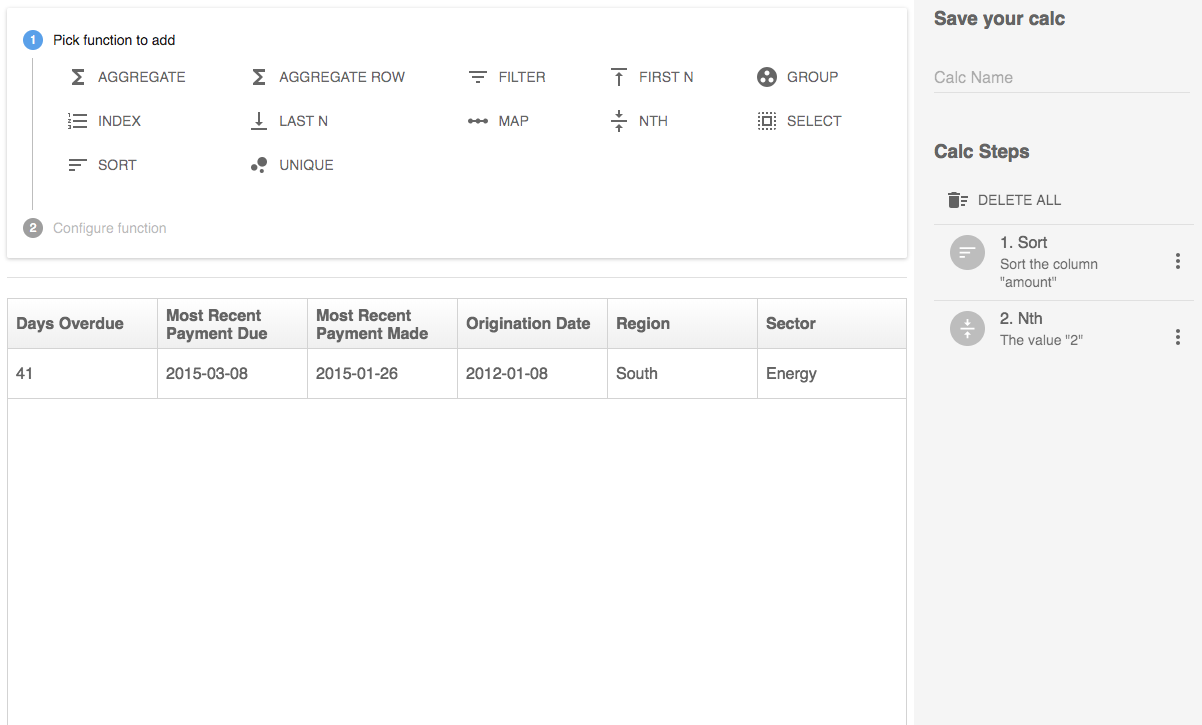
This will give me a row for the state with the second highest total loan amount.
Select
Select allows you to choose specific columns to keep in your table. You'll just choose the column or columns to keep in the table. You can select as many as you want to keep, but commonly Select will be one of the last steps in a calc.
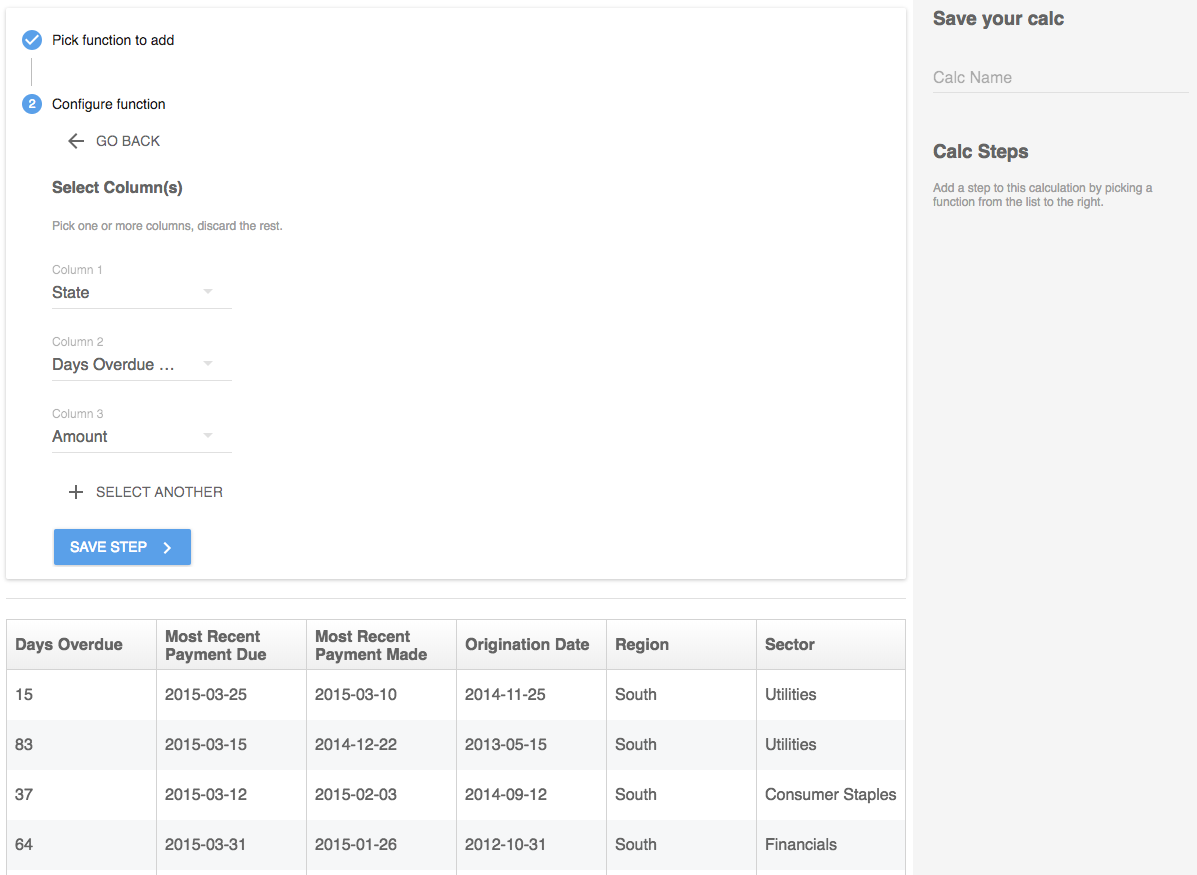
In this example, we only want to keep columns in the table for State, Days Overdue Bin, and Amount. So we'll select those.
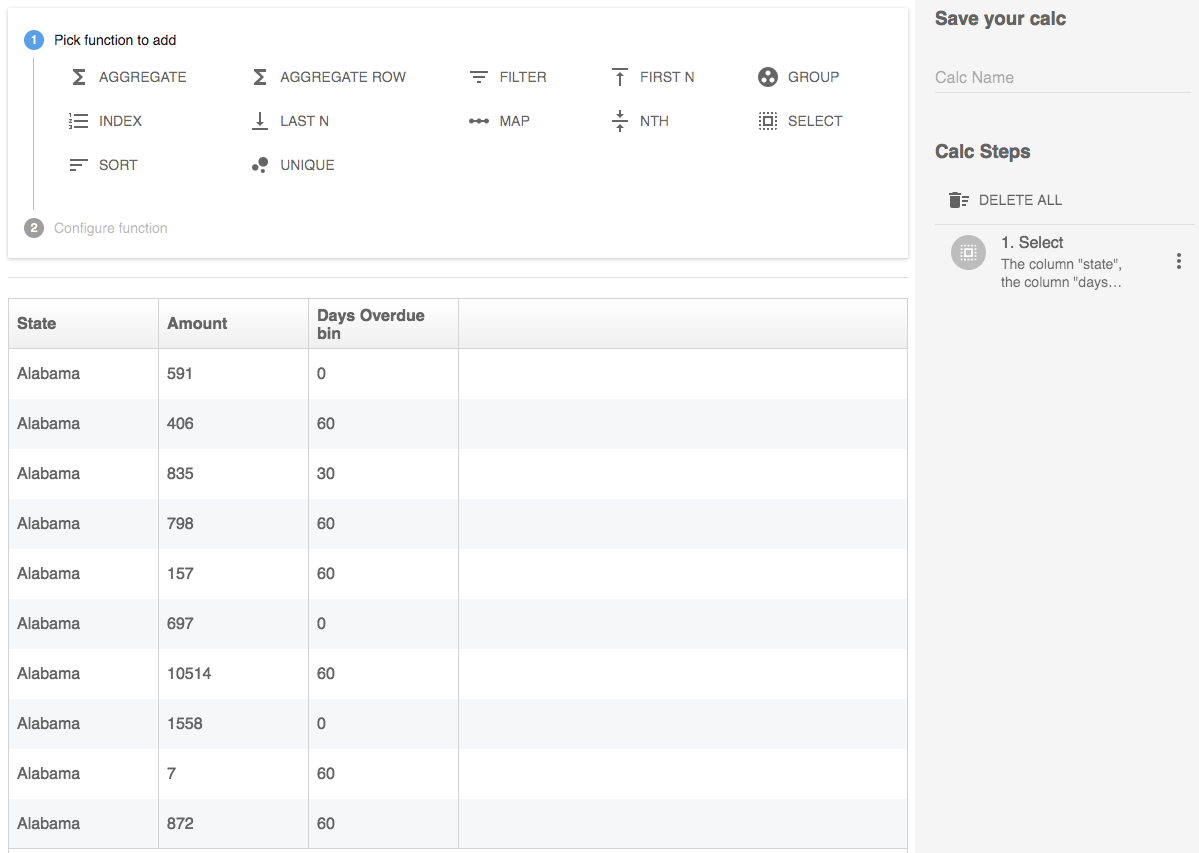
Now we'll just see those 3 columns we selected in the table.
Sort
Sort allows you to order the rows in your table. You'll choose the column to order by and if you want the rows in the table sorted in ascending or descending order. You can also select secondary columns to sort by in the case of a tie in your data.
This is a common function that will be used in a lot of calcs, particularly before any function that relies on a specific order, like First N, Index, Last N, and Nth.
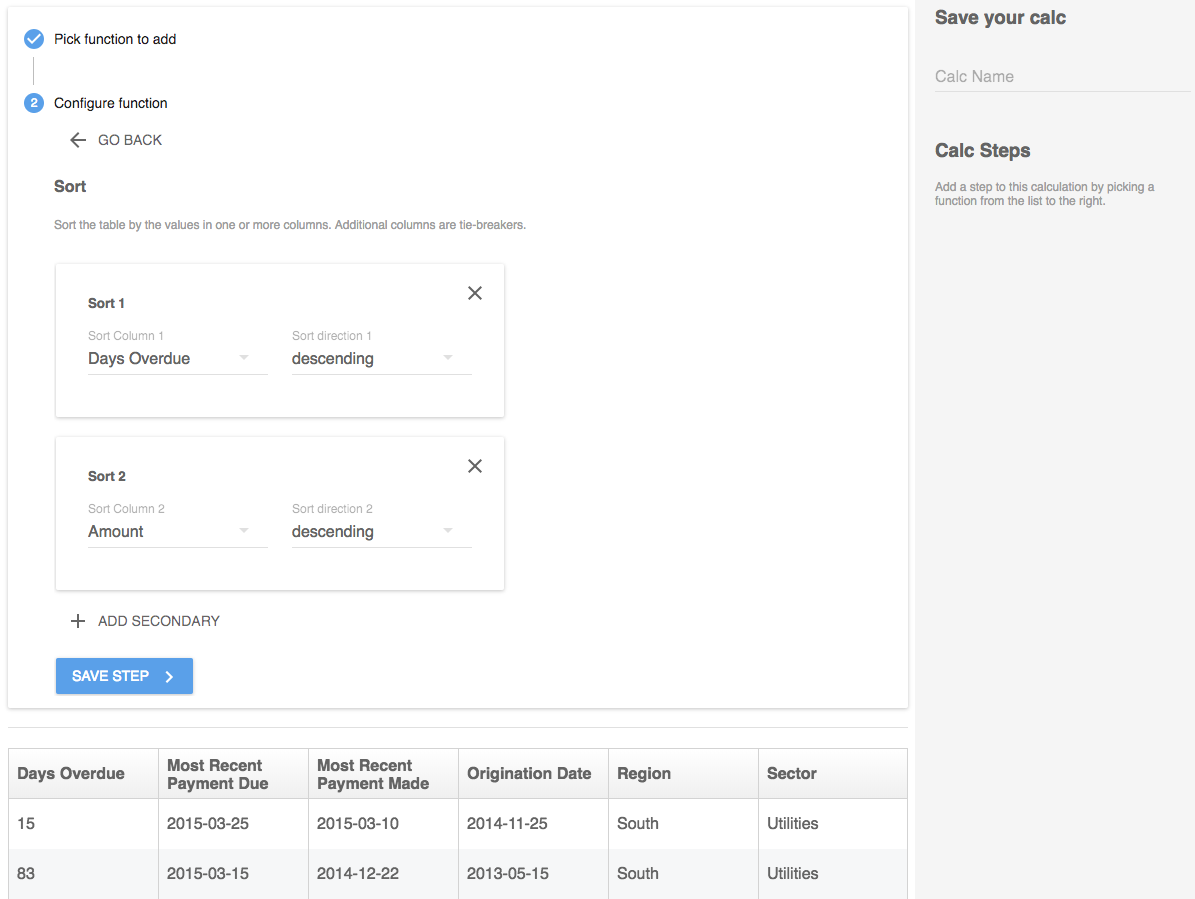
In this example, we want to see the row of data with the oldest loan. So we'll select the Days Overdue column and sort it in descending order. But because there could be rows of data with the same value for Days Overdue, we'll select a secondary sort on the Amount column.
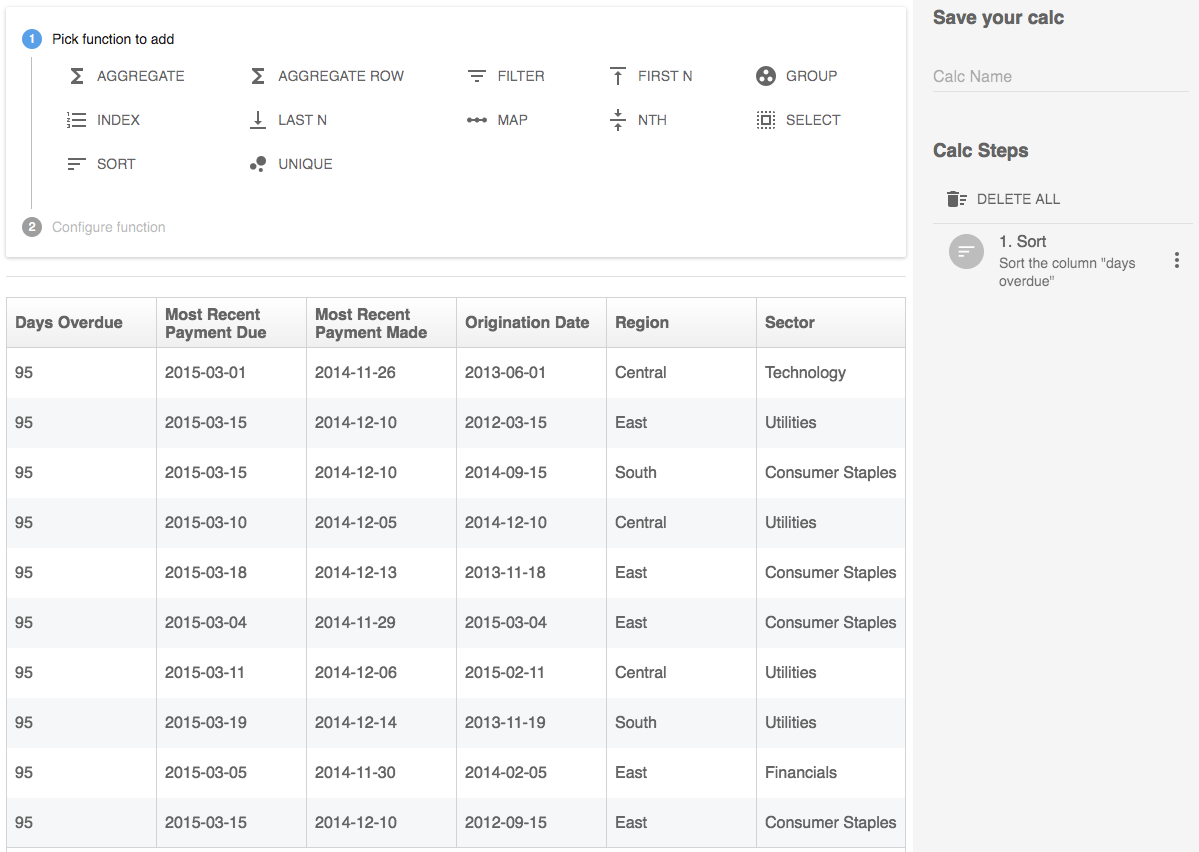
This will give us a table with top rows that have the oldest and larges loan amounts.
Unique
The Unique function will return just the unique values in only one column. This is usually the last step in a calc, and commonly used to create a List of values.
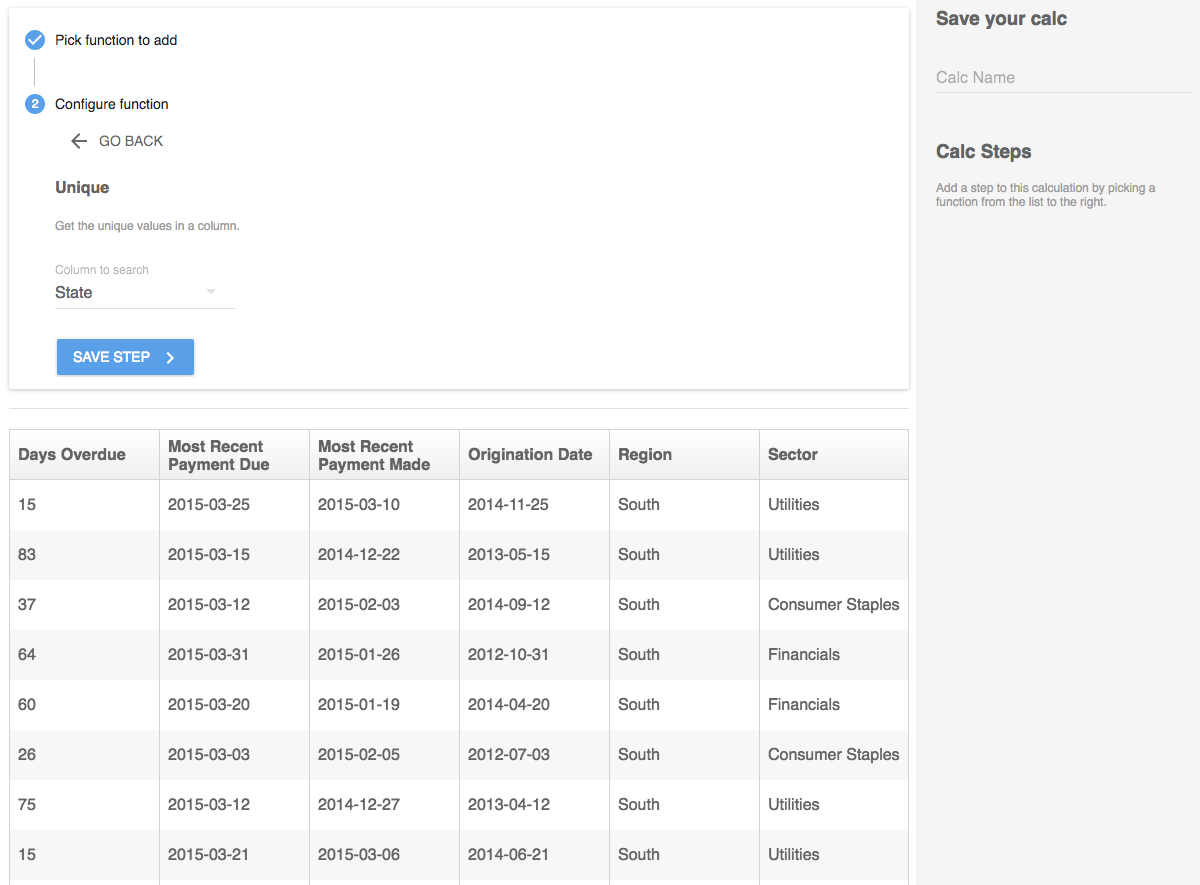
In this example, we just want a list of all of the states included in this table. Because there could be multiple rows for the same state, we'll use the Unique function.
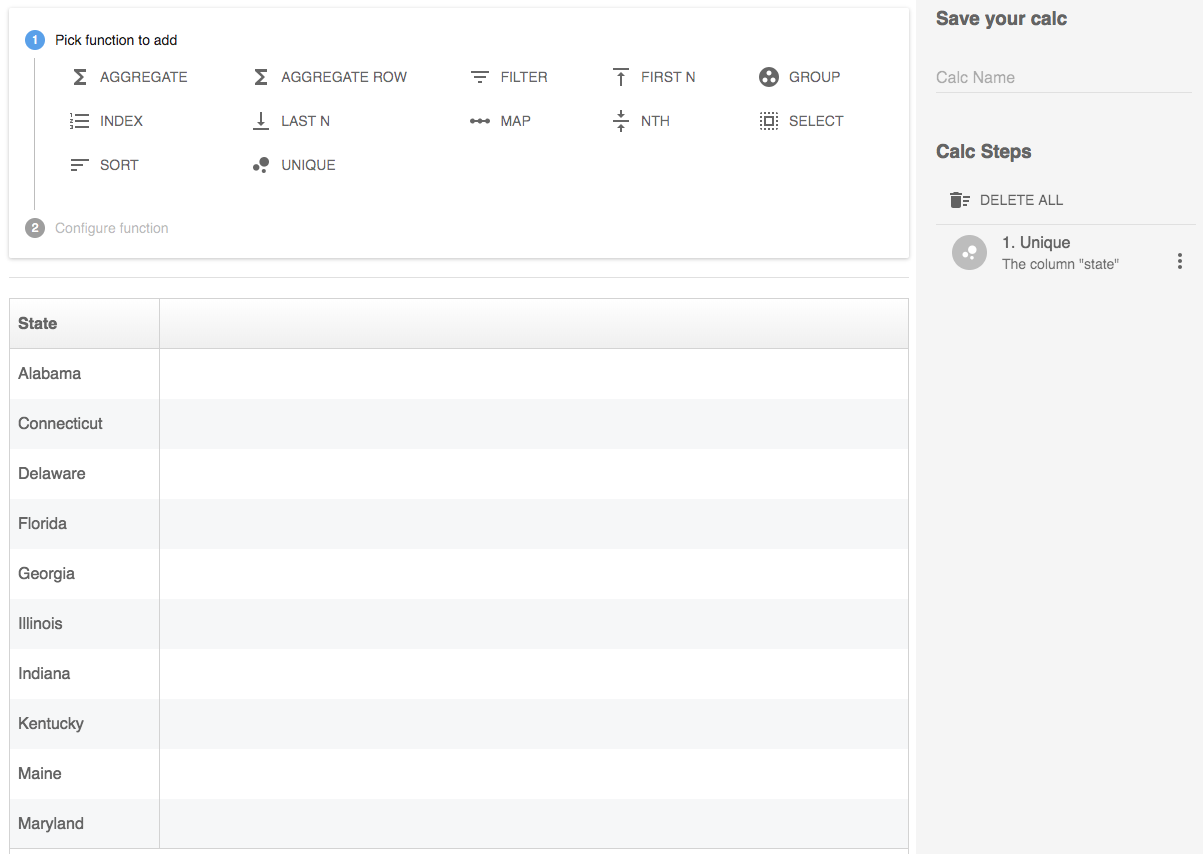
This will give us the one column we selected with only unique values on each row.
Common Calcs
Get the top performer
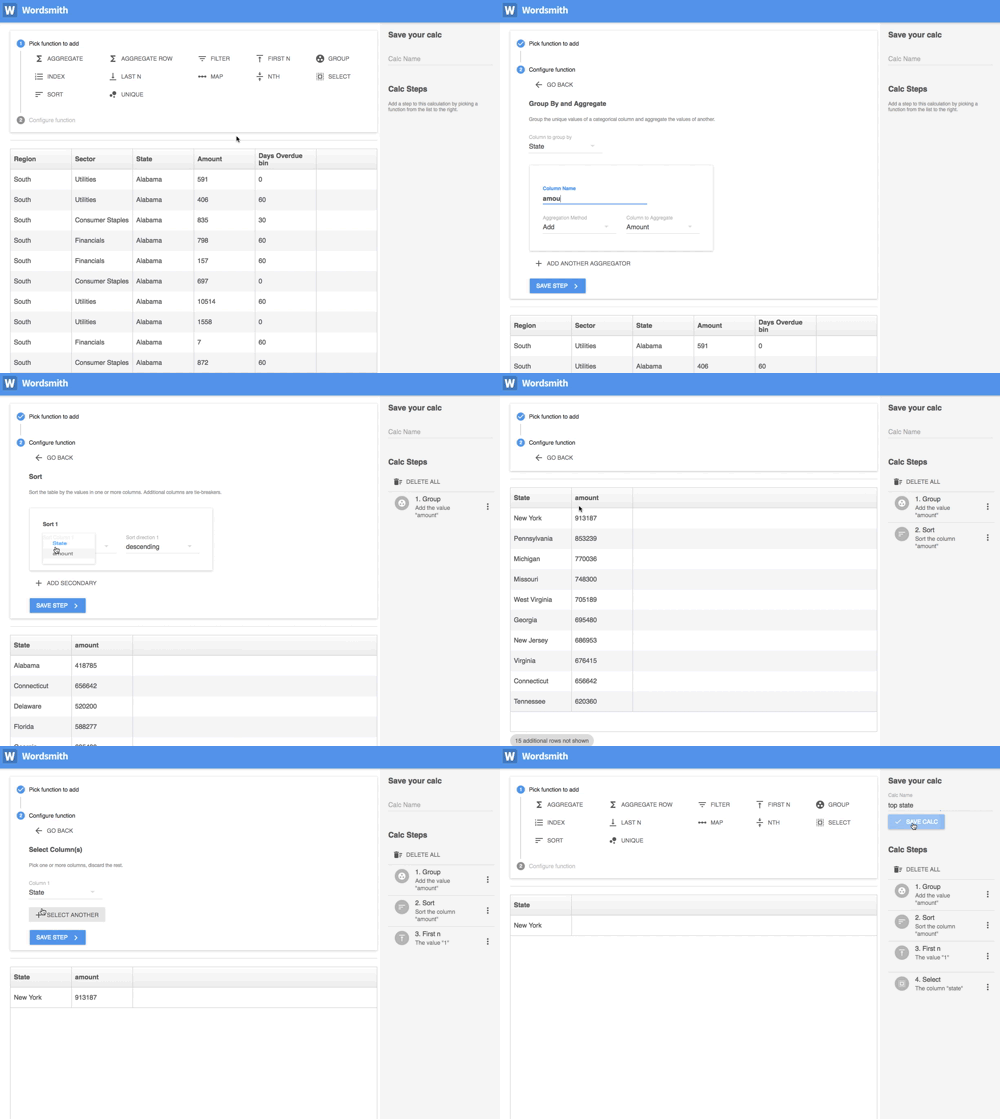
New York is the state with the highest loan amount.
- Group State column by adding up loan amount.
- Sort Amount in descending order.
- First N of 1 to get the top row.
- Select the State column.
Get another metric for a calc you created
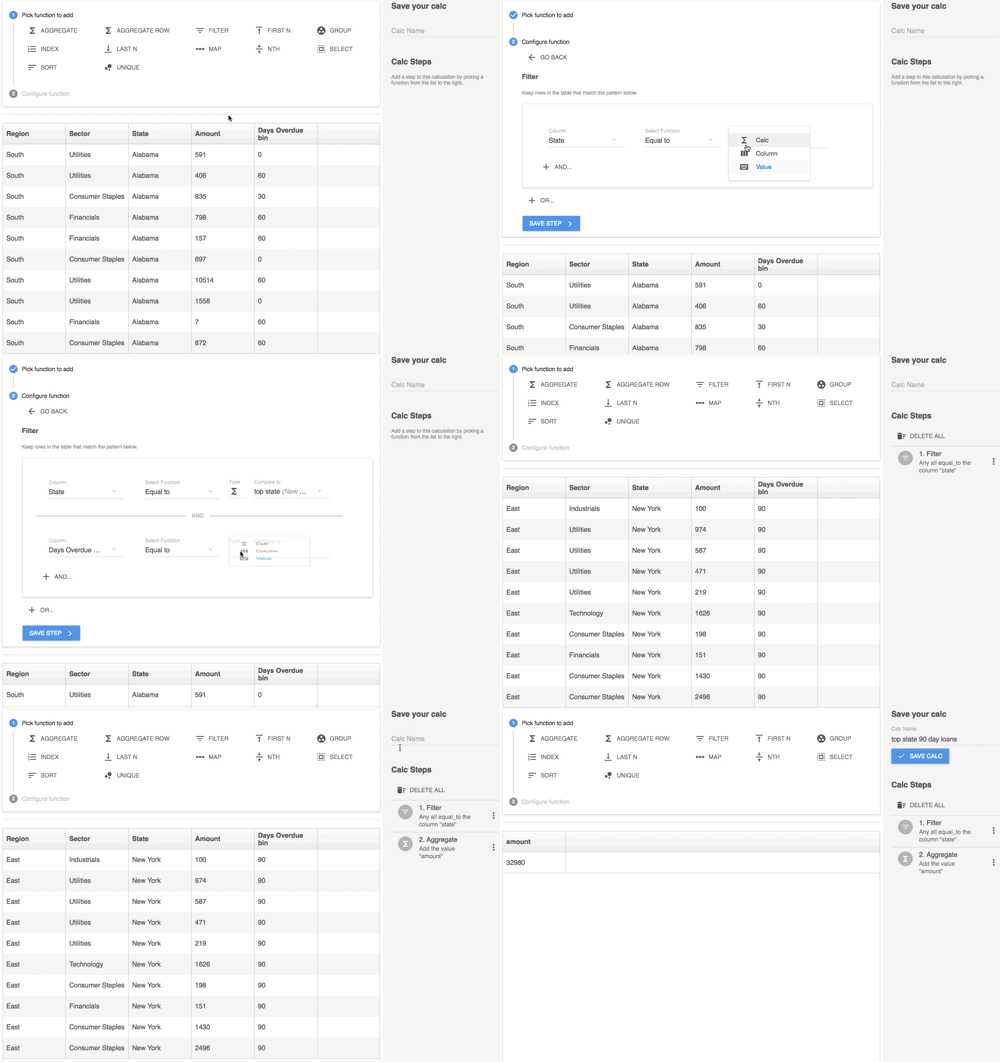
New York is the state with the highest loan amount, but it only has $32,980 in loans more than 90 days overdue.
- Filter by State column being equal to the calc for top state and Days Overdue Bin being equal to 90.
- Aggregate by adding up Amount.
Get the rank of a Calc you created in another worksheet
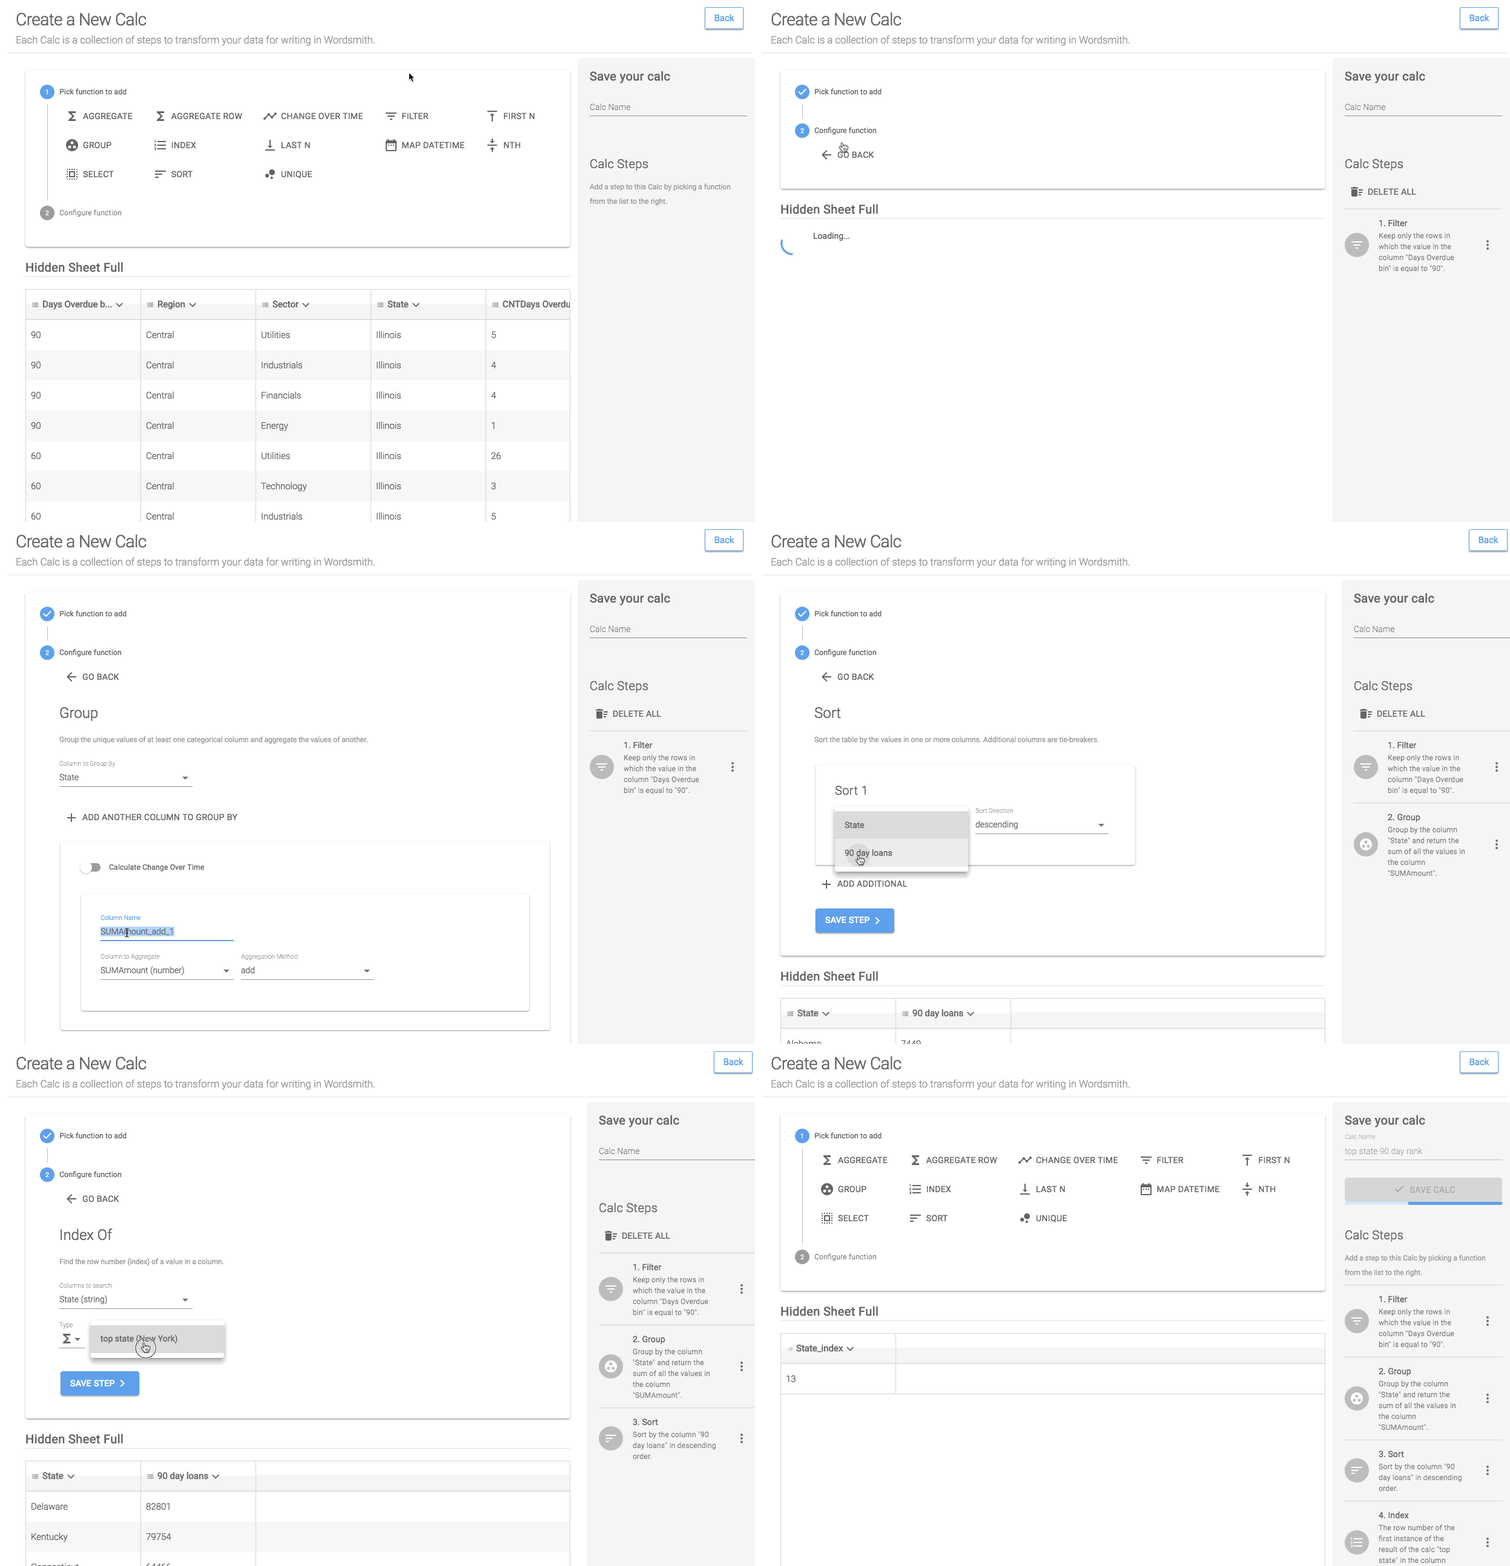
New York is the state with the highest loan amount, but it is only 13th highest in loans more than 90 days overdue.
- Filter by State column being equal to the calc for top state and Days Overdue Bin being equal to 90.
- Group State column by adding up loan amount.
- Sort the new loan amount column in descending order.
- Get the Index of the State column that is equal to the type: Calc for the top state.
Do math across columns in the worksheet
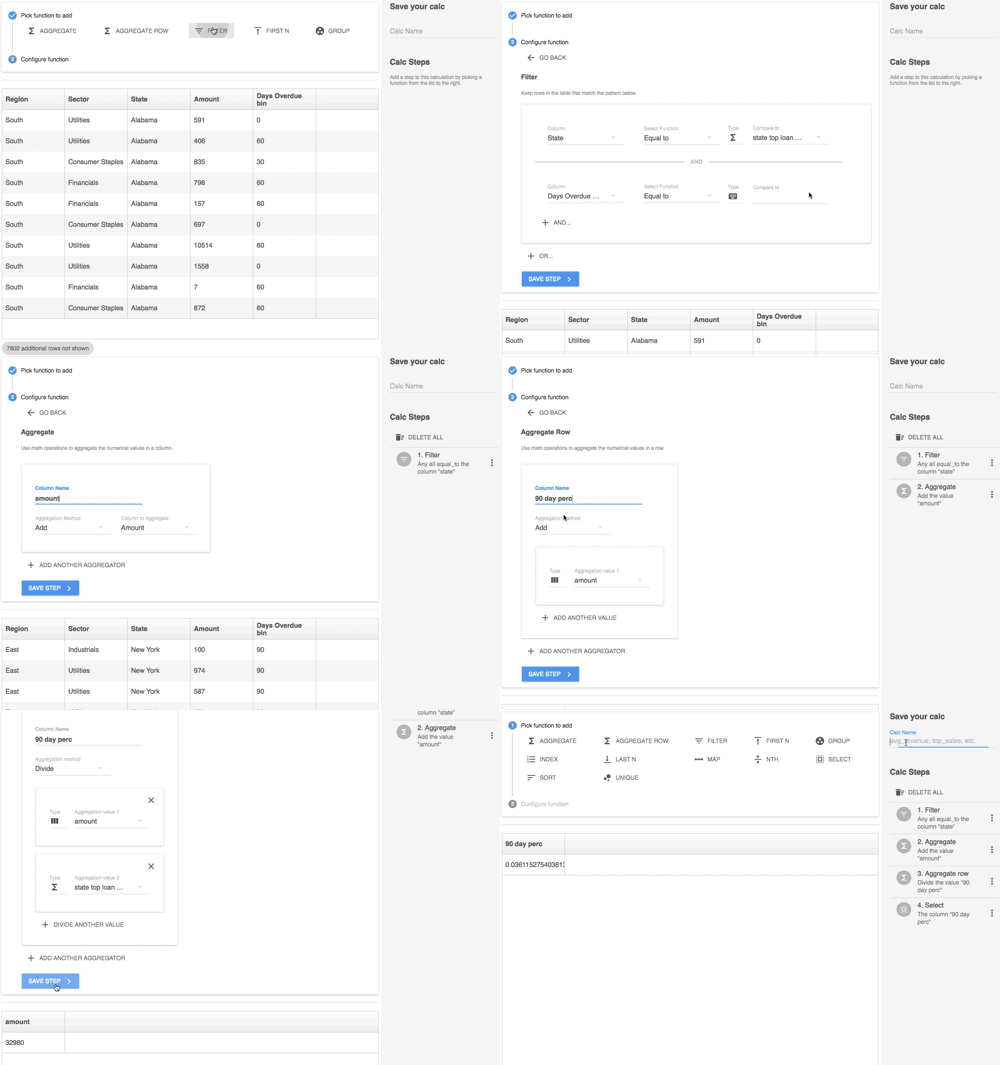
New York is the state with the highest loan amount, but only 4% ($32,980) of loans are more than 90 days overdue.
- Filter to when the State column is equal to a calc for the top state by total loan amount and the Days Overdue Bin is equal to 90.
- Aggregate by adding up the Amount column.
- Aggregate row to divide the Amount column by a calc for the loan amount for the top state.
- Select the new column in the table.
Get the next highest performer
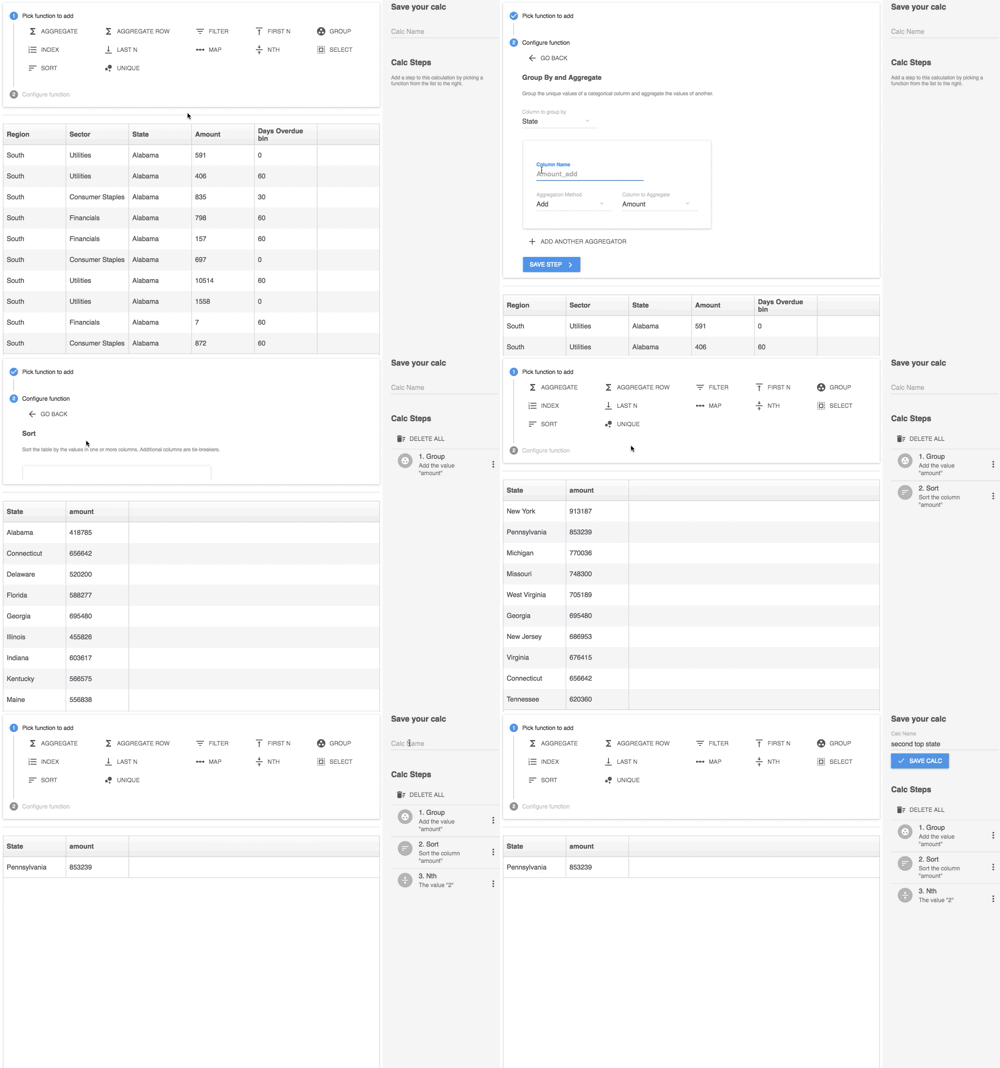
New York is the state with the highest loan amount, but only 4% ($32,980) of loans are more than 90 days overdue. It is followed by Pennsylvania with $853,239 in outstanding loans.
- Group State column by adding up loan amount.
- Sort Amount in descending order.
- Nth of 2.
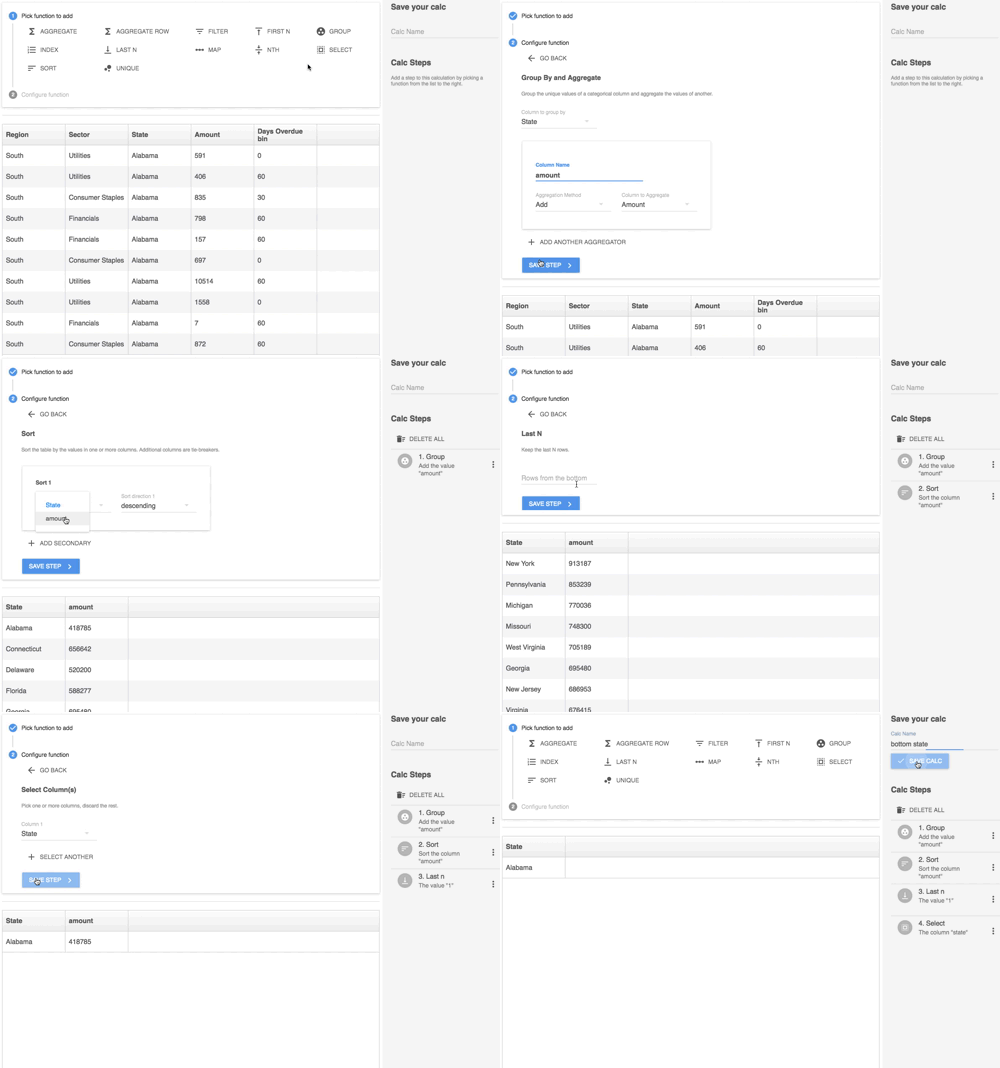
Get the bottom performer
Alabama has the least risk.
- Group State column by adding up loan amount.
- Sort Amount in descending order.
- Last N of 1 to get the bottom row.
- Select State.
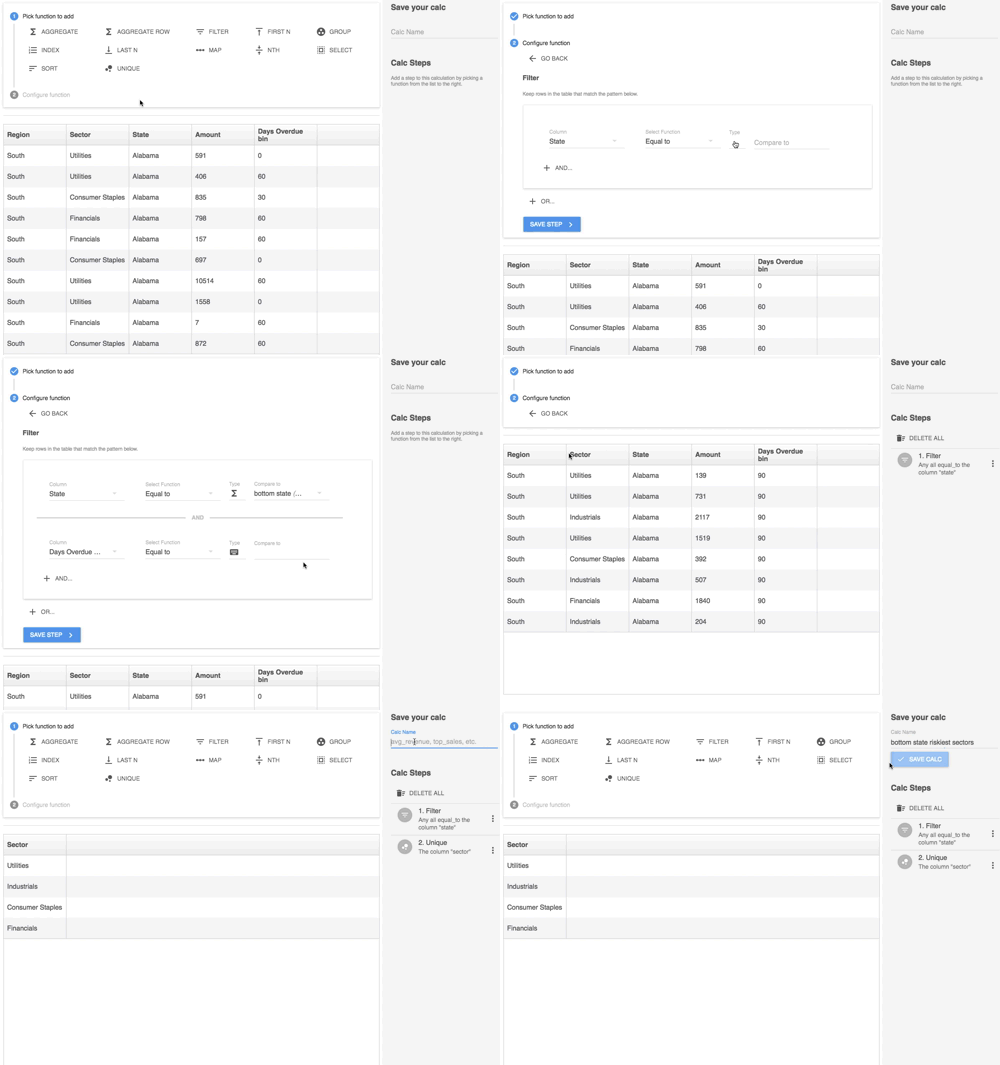
Create a list of values in a column
Alabama has the least risk, with 90-day loans in the Utilities, Industrials, Consumer Staples, and Financials sectors.
- Filter to when the State column is equal to a calc for the bottom state and the Days Overdue Bin is equal to 90.
- Unique on the Sector column.
Updated over 6 years ago
