The Complete Getting Started Guide
This page will help you get started with Knowledge Base. You'll be up and running in a jiffy!
STEP 1: Prepare your data
In order to generate narratives, Wordsmith requires structured data. There are two ways to send data to Wordsmith - uploading a CSV file from a spreadsheet program like Microsoft Excel, or sending a JSON file to the Wordsmith API. You'll need to first start with a spreadsheet to create your Wordsmith Template, but once your Template is created, you can choose to upload data manually or use the API.
Every row is a unique narrative
When Wordsmith produces narratives, any data that is in the same row can be part of the same narrative. Each row generates a separate narrative.
Because of this, you’ll want to prepare your spreadsheet with all the data you need before you upload it into Wordsmith. And if you have hierarchical data, you'll need to flatten it before using in Wordsmith.
Adding data as columns to your CSV
Every new column enriches your narrative by adding one additional data point you can use in your Template. And you can add columns to your data in the Wordsmith app by going to the Data tab. While there are many reasons to add columns, common reasons include:
- Adding historical data, such as the previous month or previous year.
- Adding max, minimum, average, and standard deviation for a metric.
- In general, the more columns you have, the richer your narrative can be.
You'll only see up to 35 columns and 50 rows of data on the Data tab. If your spreadsheet has more than 35 columns or 50 rows, and you want to edit it, simply download the file, make your changes, and upload the new file.
Adding formulas in Wordsmith
You can also create columns based on formulas from your data in Wordsmith that you can use in that Template.
Say you have current sales data and previous sales data in your CSV. With just those 2 data points, you can automate a sentence that says: Sales this period were greater than last period.
But if you add a formula in Wordsmith for the percentage change in sales from the previous period to the current period, then you can say: Sales this period have jumped 55% over last period.
Other ideas for formulas include:
- Adding percent change from one column to another (like the above example of the change in sales between time periods)
- Converting data to different time lengths (i.e., multiplying by twelve to turn monthly data into year estimates, dividing by 24 to get hourly averages, etc.).
- Averaging other columns (to determine whether something is above or below average).
- Combining two text strings. (If you have one column that includes the month and one column that includes the year, you can create a column that has both "May 2016".)
Learn more about adding formulas to your Wordsmith Template here.
Adding rows
If you want Wordsmith to create additional narratives, you need to add rows to your spreadsheet. If you want to report on another dimension of your data, you can create a second CSV file and a second corresponding Template. For instance, if you wanted to have one set of reports for each week of data and one set for each state, you could have a CSV/Template pair for each. You'll also need to put a separate data file in its own Project, but we'll get to that later.
You can change your data later
Although it’s good to prepare your data as much as possible before uploading it to Wordsmith, many users find they need additional rows or columns after they’ve begun to build their Templates. Not a problem — you’ll be able to upload an updated CSV or make changes on the Data tab. And if any column headers you're using in your Template change, you'll be notified to fix that in the Template Editor.
STEP 2: Prepare your narrative
After your data is prepared, think about the text you want to write. Write a sample report, summary, product description, etc. before thinking about how you will automate it in Wordsmith. Don’t think too much about how this narrative will be automated; just write with the style, tone, and insights that come naturally. This will be especially easy if you are automating reports that already exist.
Here’s a simple narrative about home sales data in different markets"
Over the last month, home sales in San Diego Metro have risen. There were 2,366 homes sold over the last 30 days. San Diego County led the way, with 1,865 sales on its own. Potential buyers should note that the median sales price rose to $450,000 while the available housing inventory also rose. There are now four months of inventory available in San Diego.
As you write this narrative, you may find that you want to discuss additional data that isn’t in your spreadsheet. Add columns to your CSV and fine-tune your narrative until you are comfortable with both.
In general, it’s a good idea to keep it simple. Wordsmith makes it easy to add more complexity and variability later on. For now, make sure you’ve nailed the basics. Soon, the narrative you wrote will become the Template for automating unique narratives about all of your data.
Handling a/an
Whenever you type a or an in your Template, Wordsmith will automatically populate the correct article when the content is generated. So just write either a or an without thinking about the possibility of the word following it changing.
STEP 3: Upload your data
If it's your first time setting up a Project in Wordsmith, we recommend you use guided workflow to create some sample data based on the text you want to write. the data wizard to mock up some sample data. This will quickly show you how your data works in Wordsmith to create text.
Once you've gone through that once, try creating a new Project on your own. Each row from your CSV file will be its own narrative in Wordsmith. So you'll want to have every data point you want to talk about included as a column in your spreadsheet. To get started with the data wizard, create a new Project.
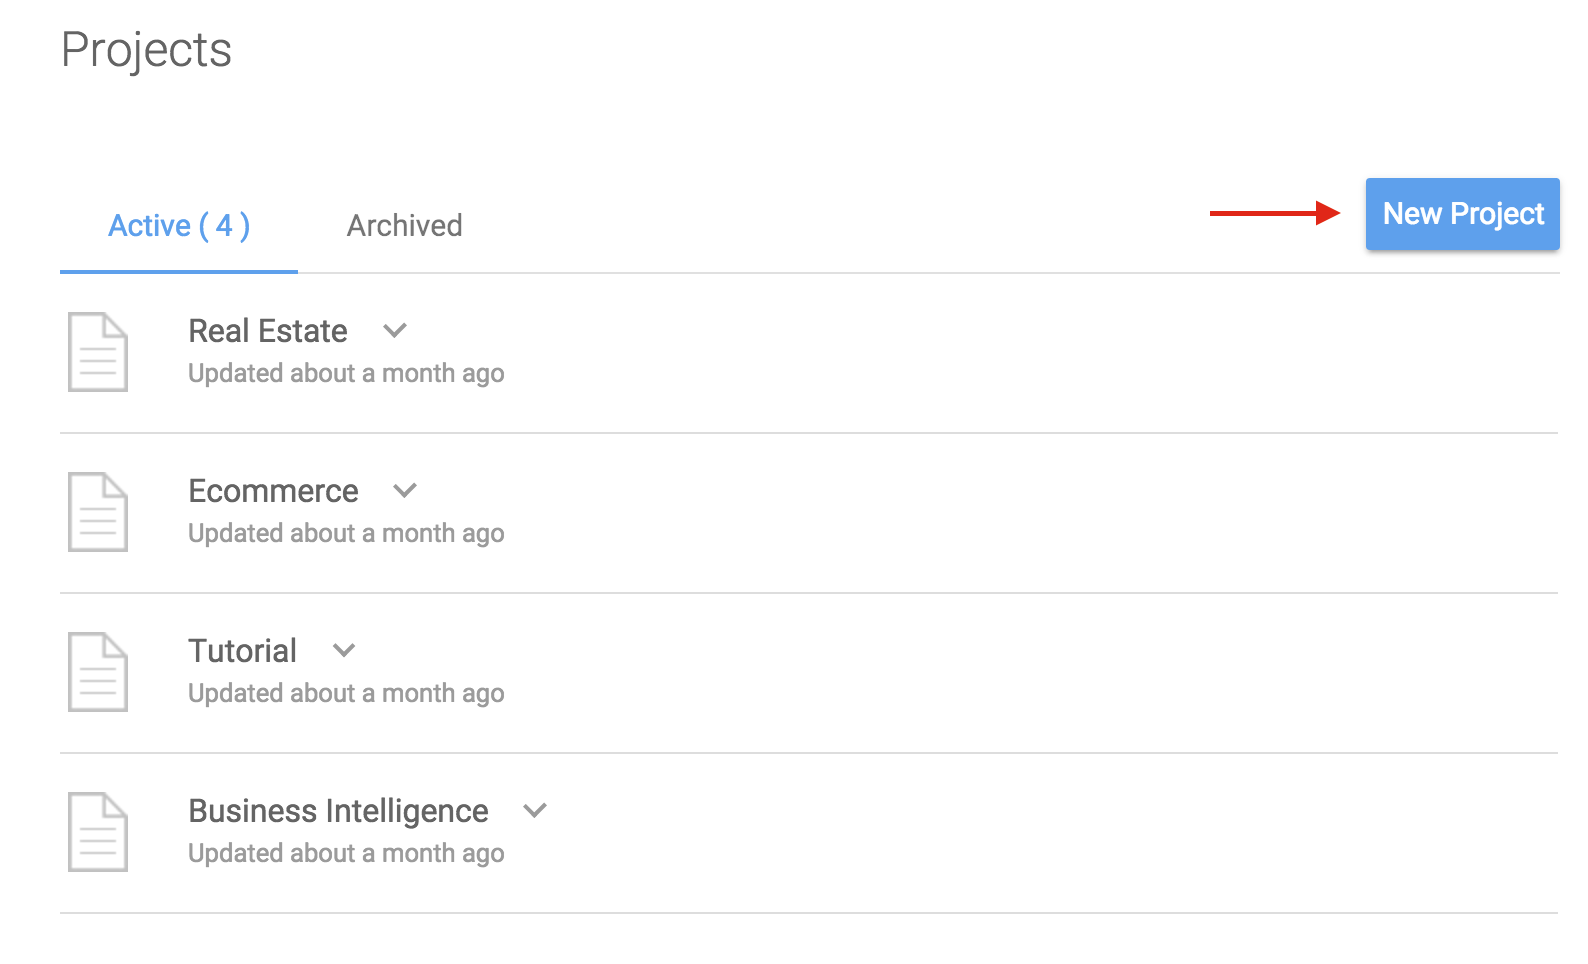
You'll be prompted to give your Project a name and upload your CSV file.
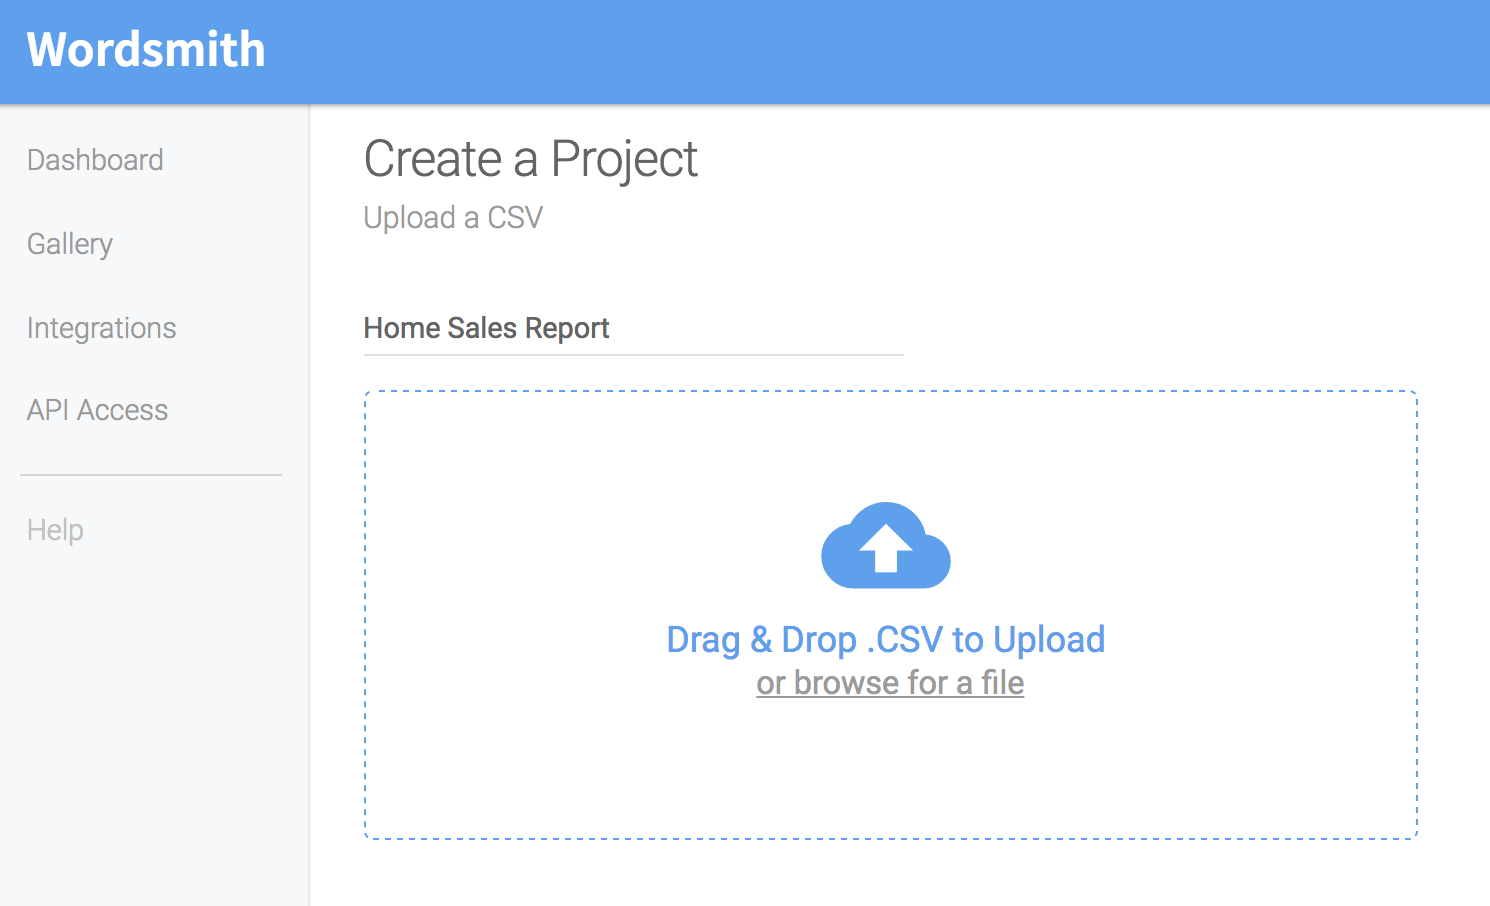
Then you'll be taken into a blank Template where you can start writing the text you want to automate. Use the text you prepared from Step 2 and either type or paste it into the Template.

Don't forget to name your Template
You'll see a default name for every new Template. So make sure to name each one you create so it will be easier to tell them apart. You can rename your Template by typing in the name field at the top of the screen.
STEP 4: Insert data into your narrative
The column headers from your CSV file have become data values that you can use in your Template. You’ll see them if you click on the green "Insert Data" button.
Highlight each word or phrase in your manually-written text that is a specific value - a proper name, for example, or a number - click "Insert Data" and choose the appropriate value from your list.
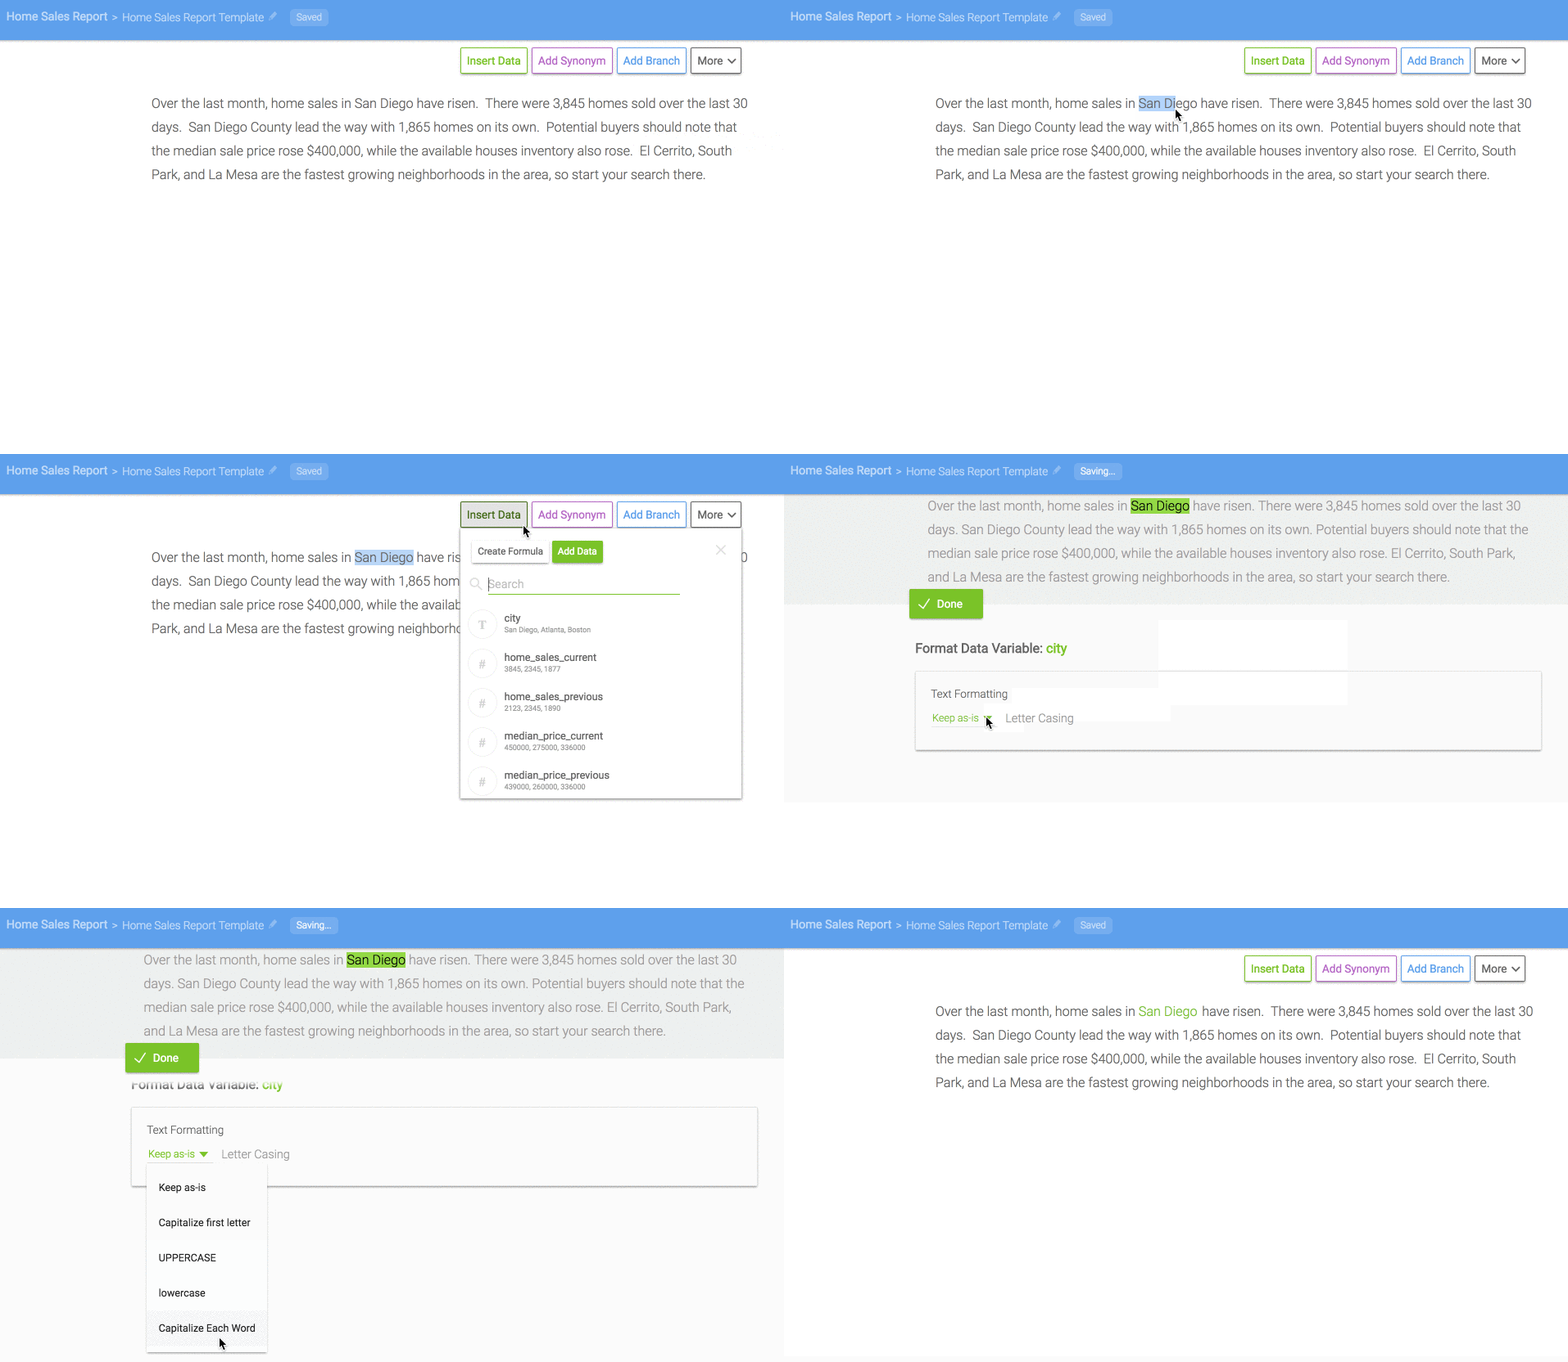
Your specific word or phrase is now a dynamic data point. Wordsmith will insert the appropriate data into every narrative based on the corresponding spreadsheet row.
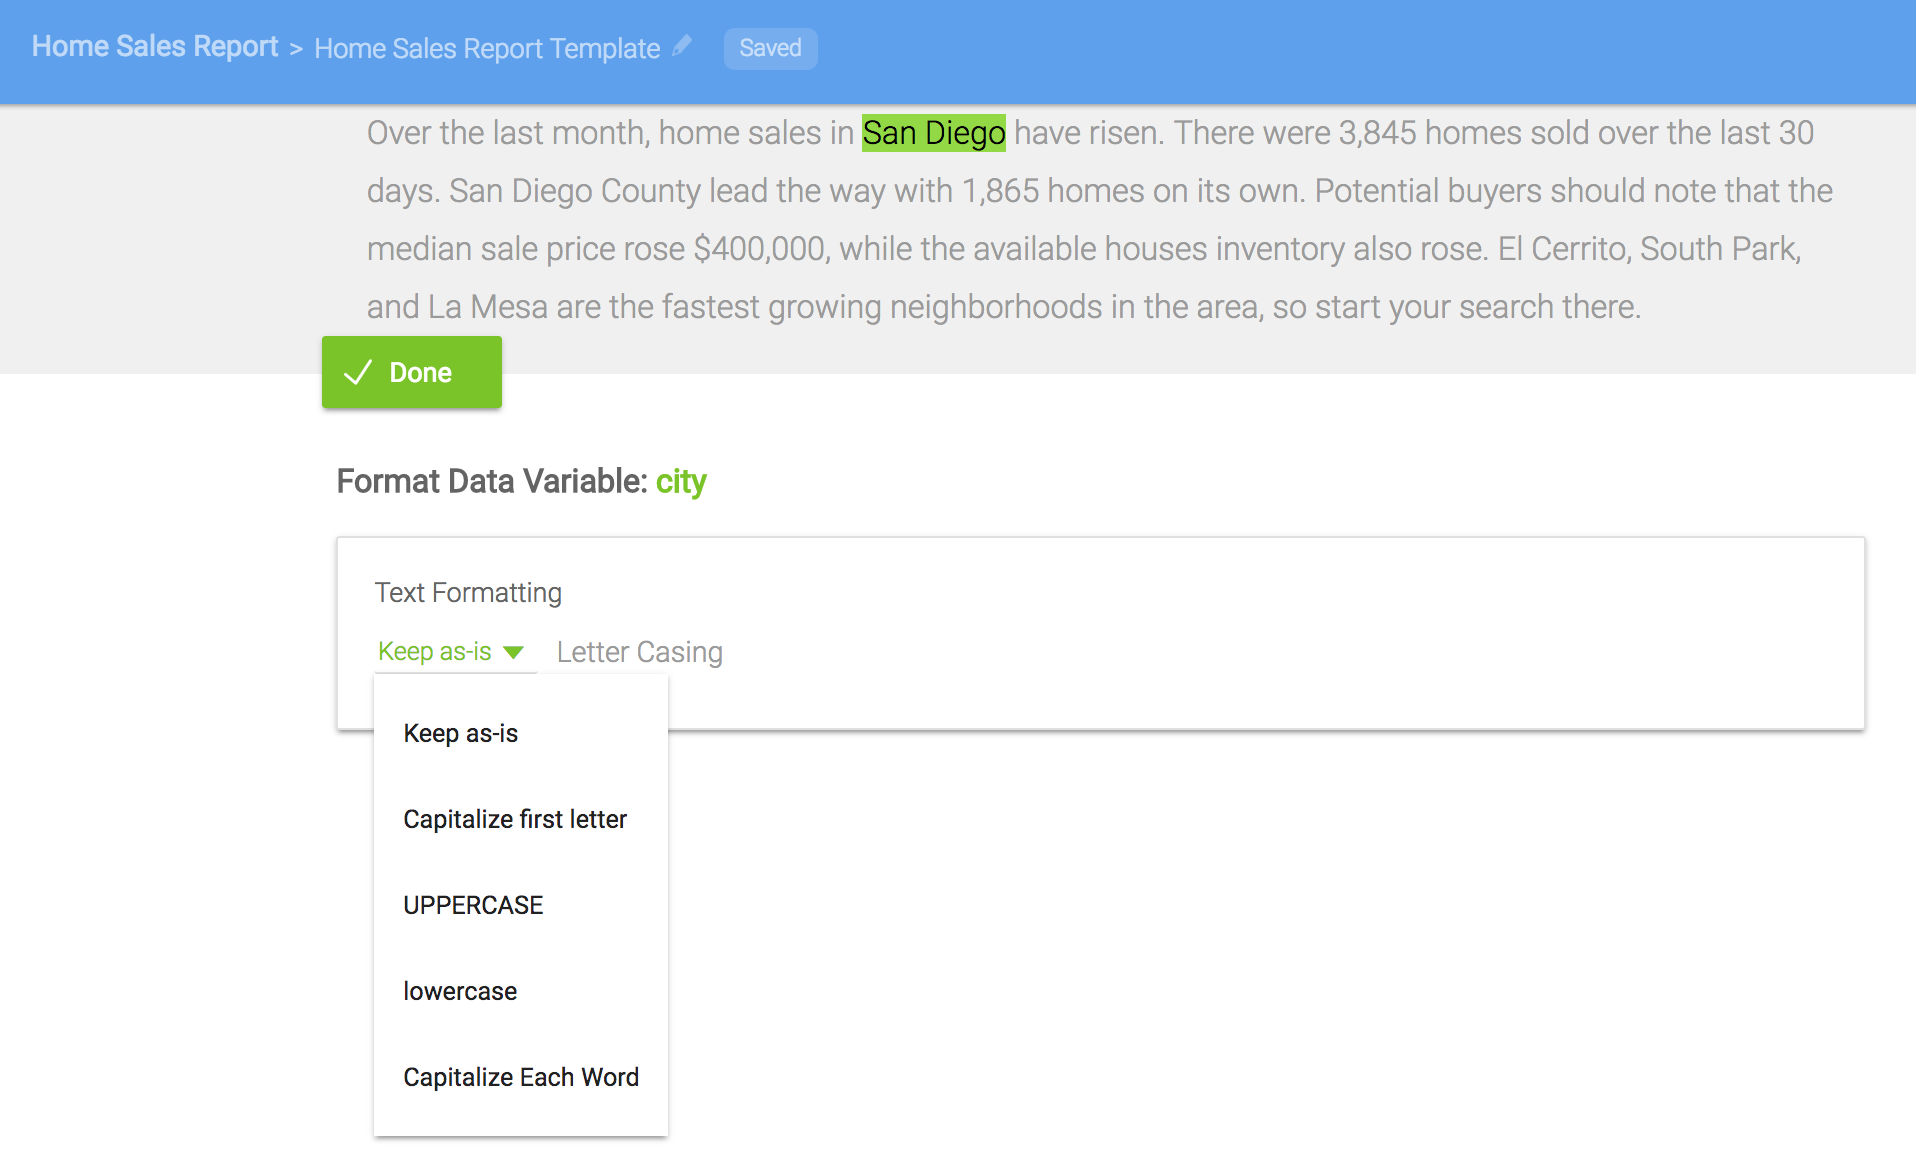
You can change how your data is represented in your text. For data points that are text strings, you can change the capitalization or "Keep as-is" will display your data in your narrative exactly as it is in the CSV.
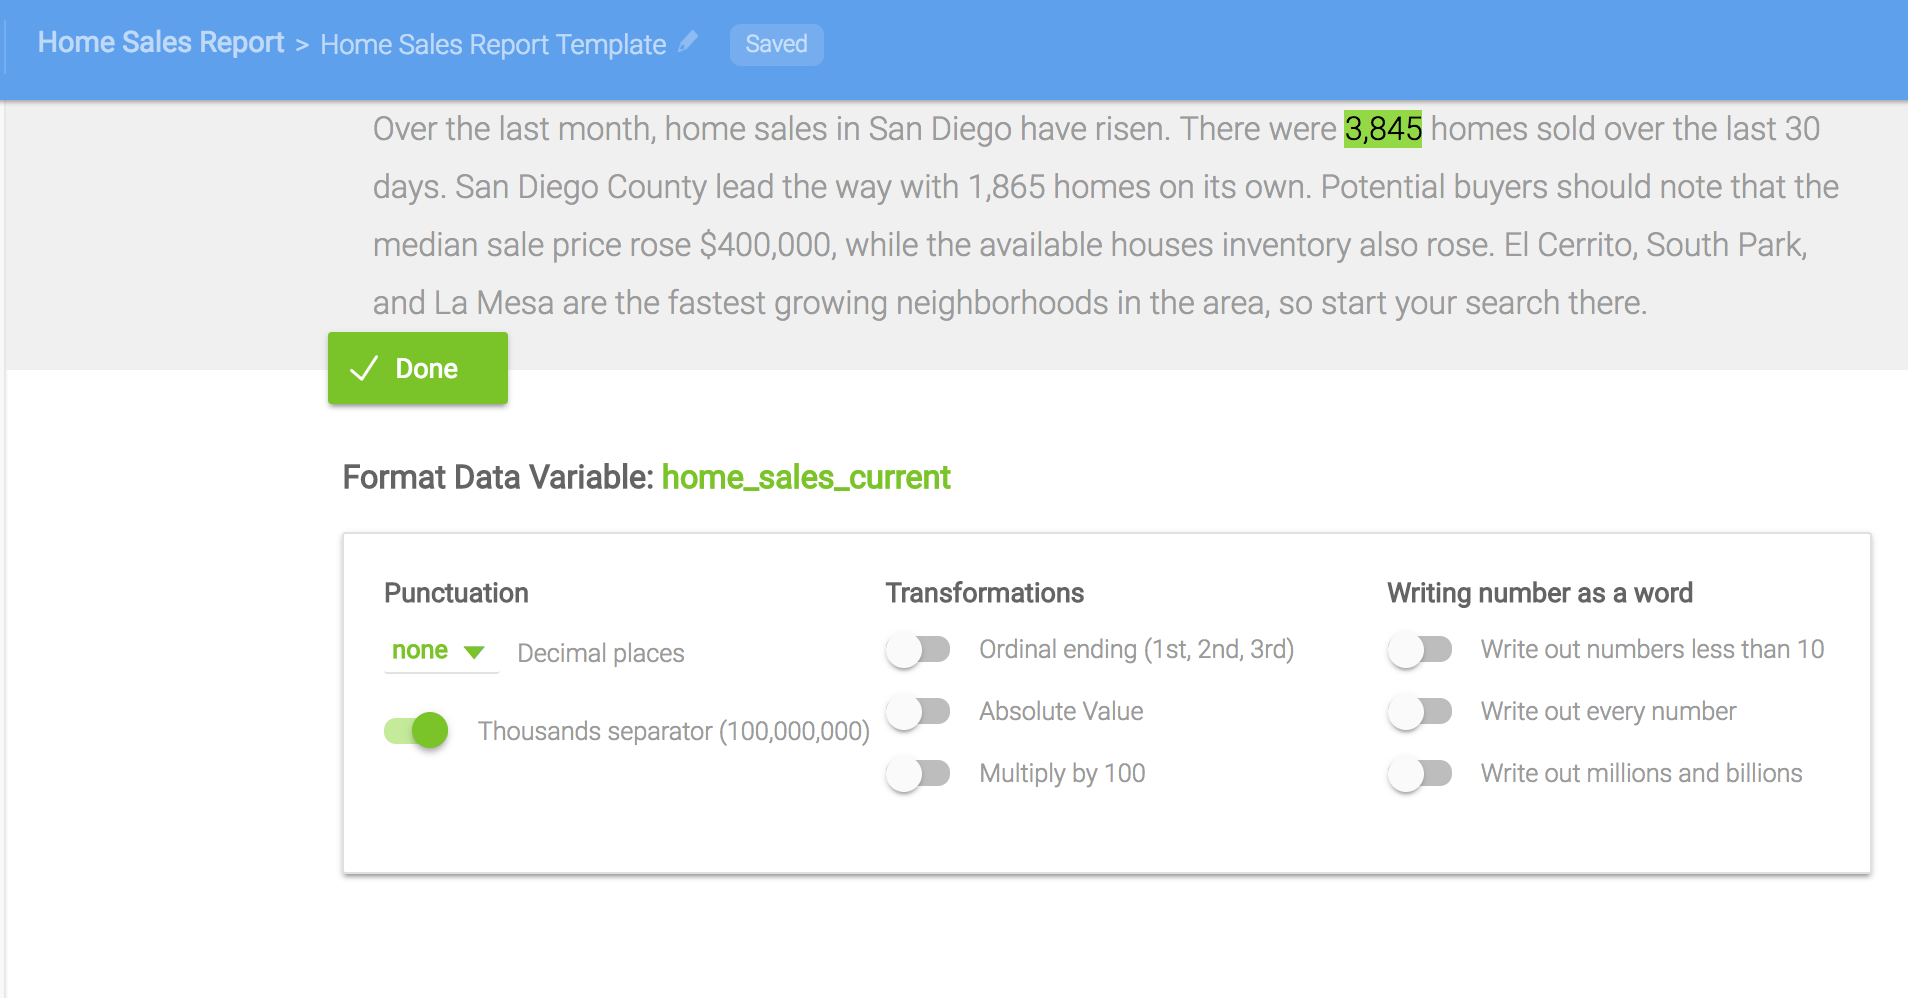
You can also change the way number data points are displayed.
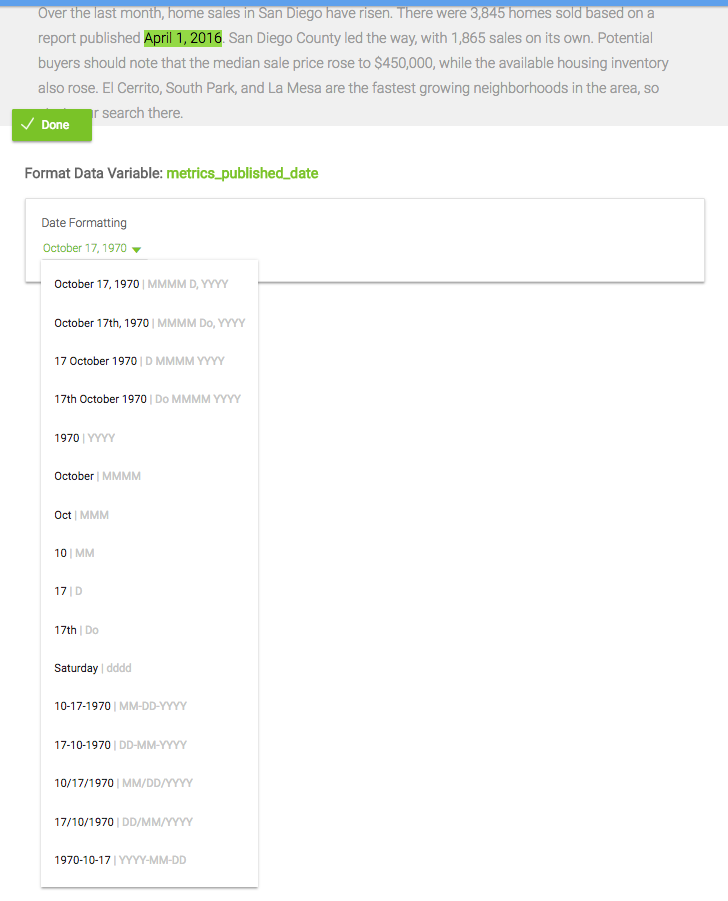
And change the way dates are written.
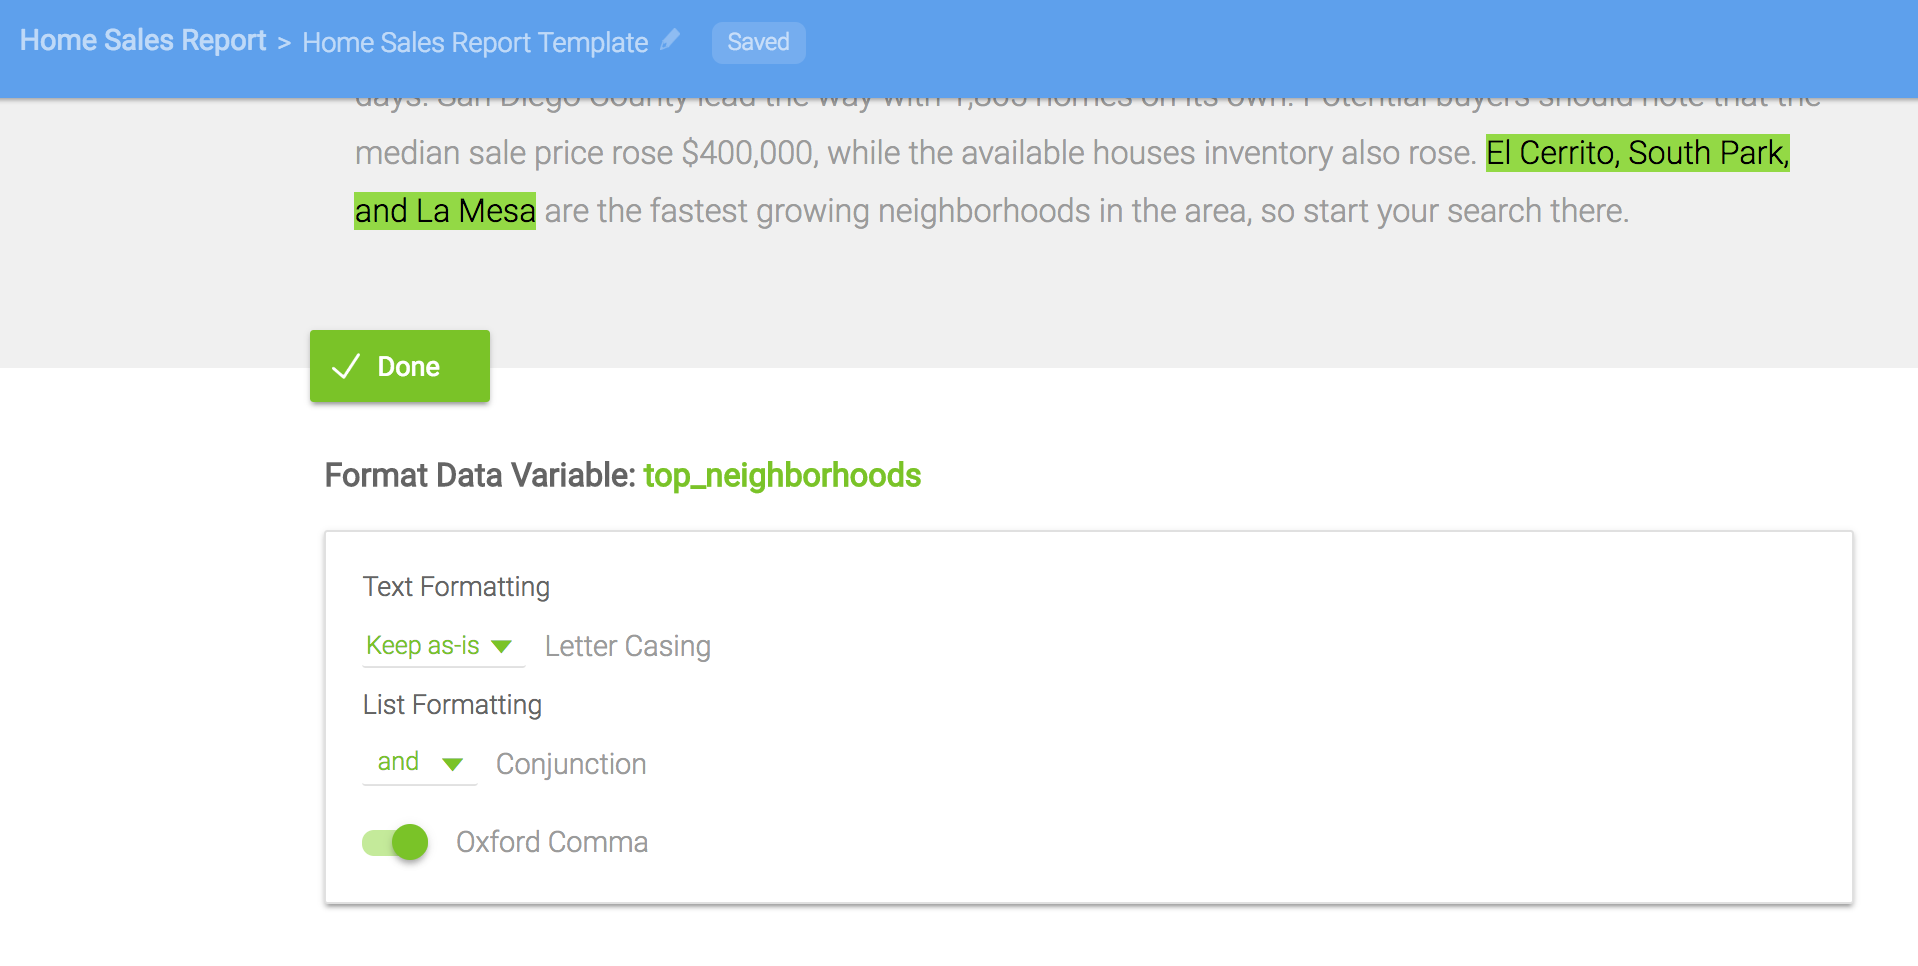
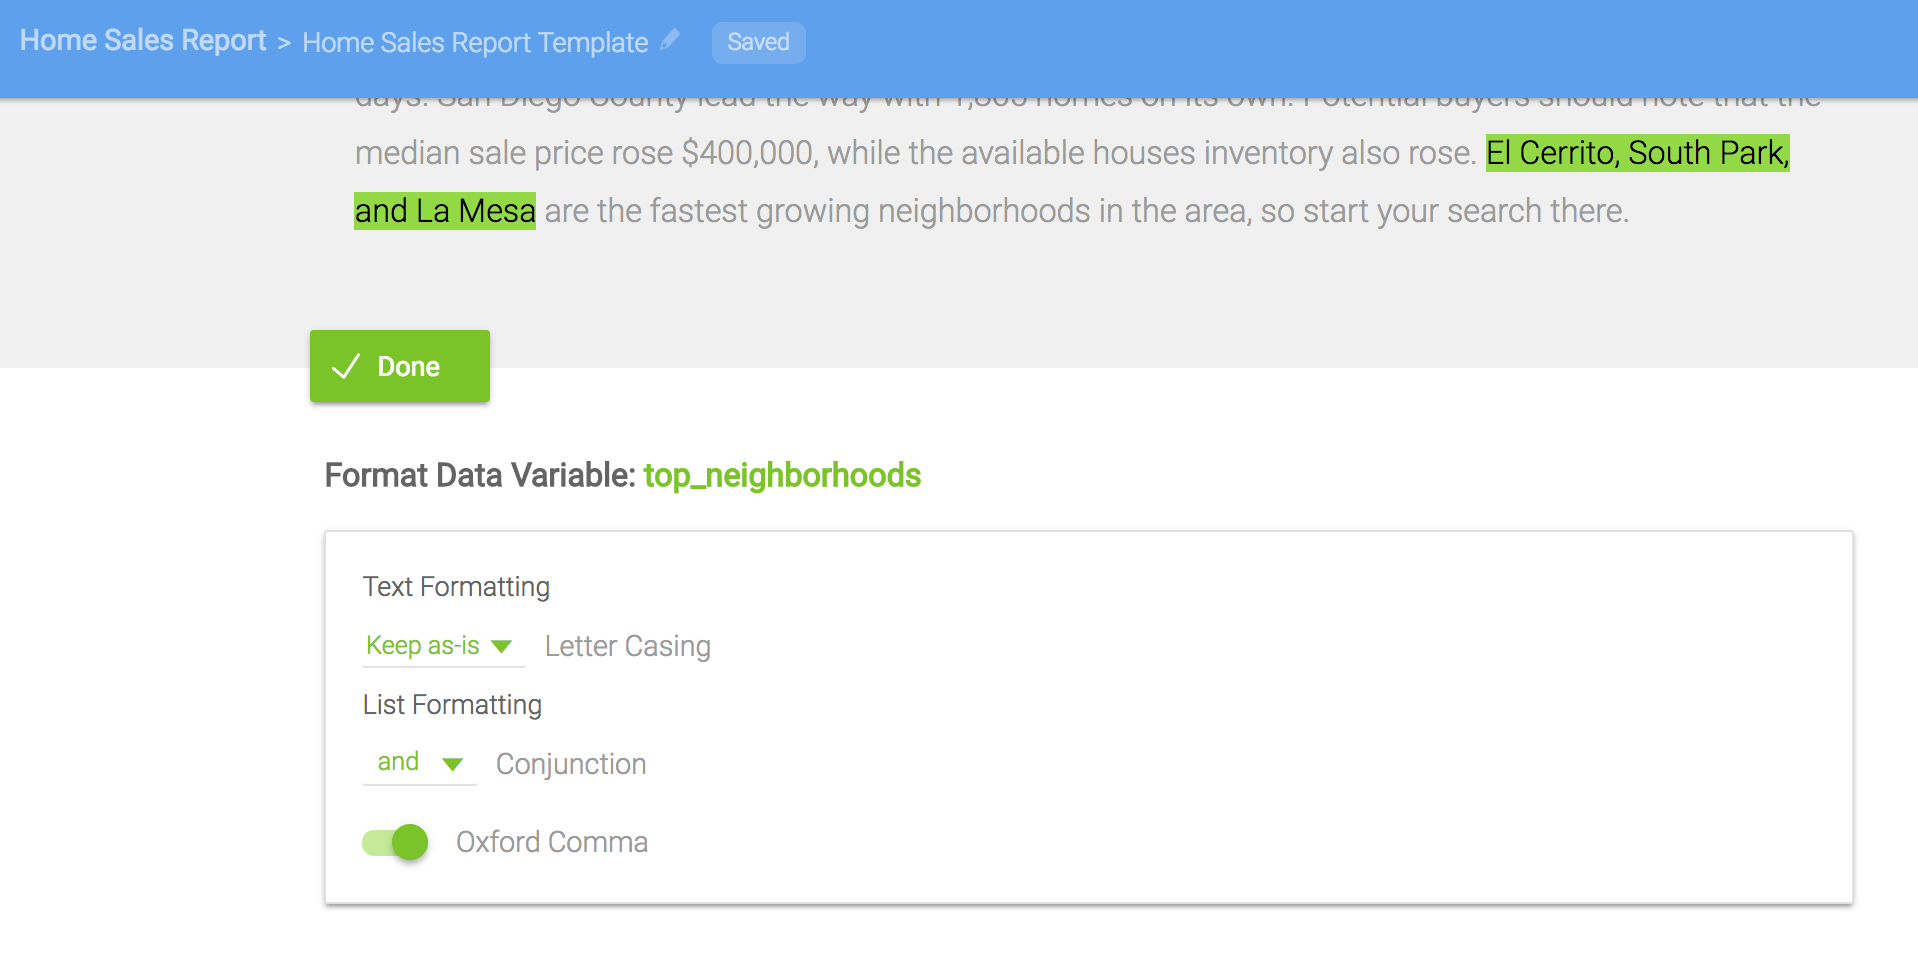
Lists are text objects separated by a comma, and you can customize the capitalization, conjunction, and comma.
True/False data, also called Booleans, is a type of data with only two options: True or False. Wordsmith will recognize data as True/False if all of the data for that data variable is either "true" or "false", "yes" or "no", or "y" or "n".
For more information on numbers, text, lists, and dates, check out the Data Types page.
Here's how our Template looks with all of the data inserted:

Wordsmith automatically categorizes the data in your CSV into numbers, text, lists, or data. You can change the data type for any of your data on this screen. To do that, click the drop-down list next to your CSV file. Then click "Save Types."
STEP 5: Add variability to your text
You can add synonymous words, phrases, or sentences to your text so that the text you generate with Wordsmith won't sound exactly the same. To add a synonym for a word or phrase, highlight it in your text and select the "Add Synonym" button. Then just use the purple plus sign to add synonymous words. Wordsmith will randomly choose one option from that list when generating each piece of content.
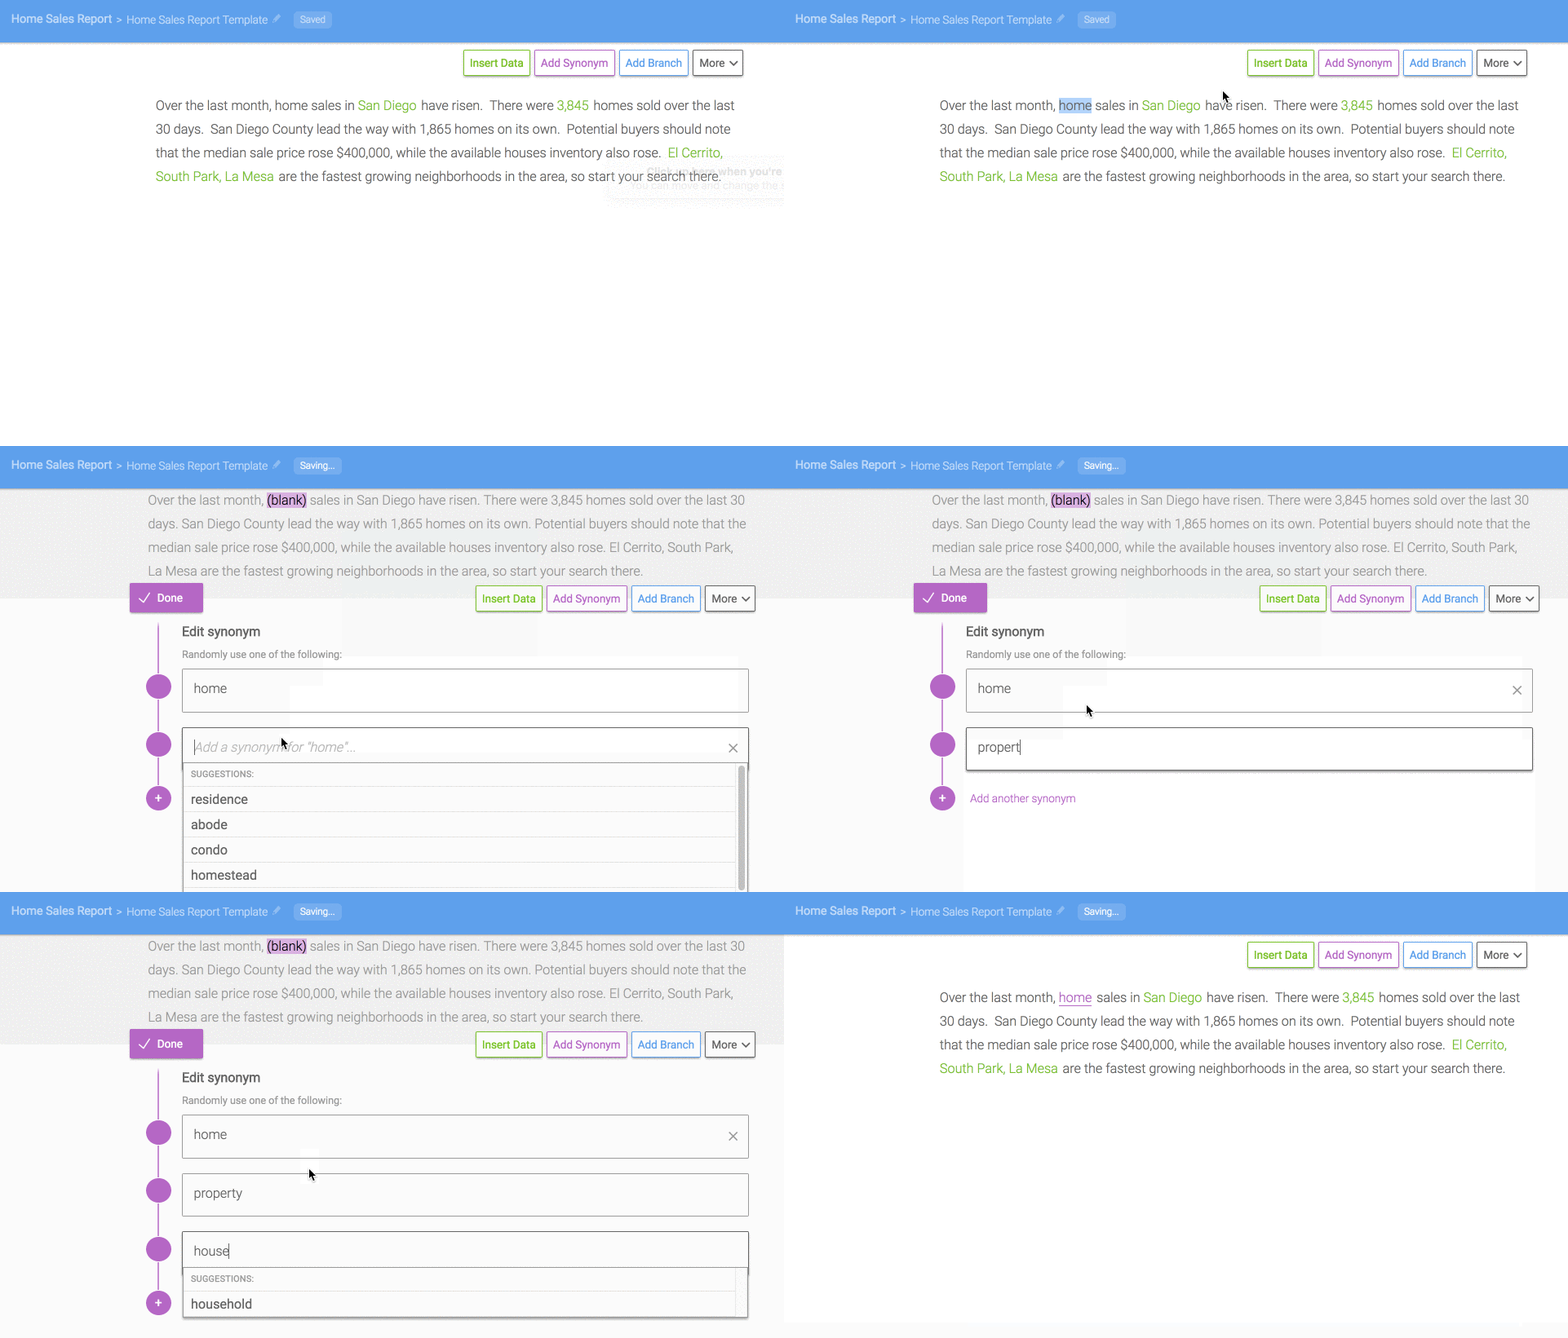
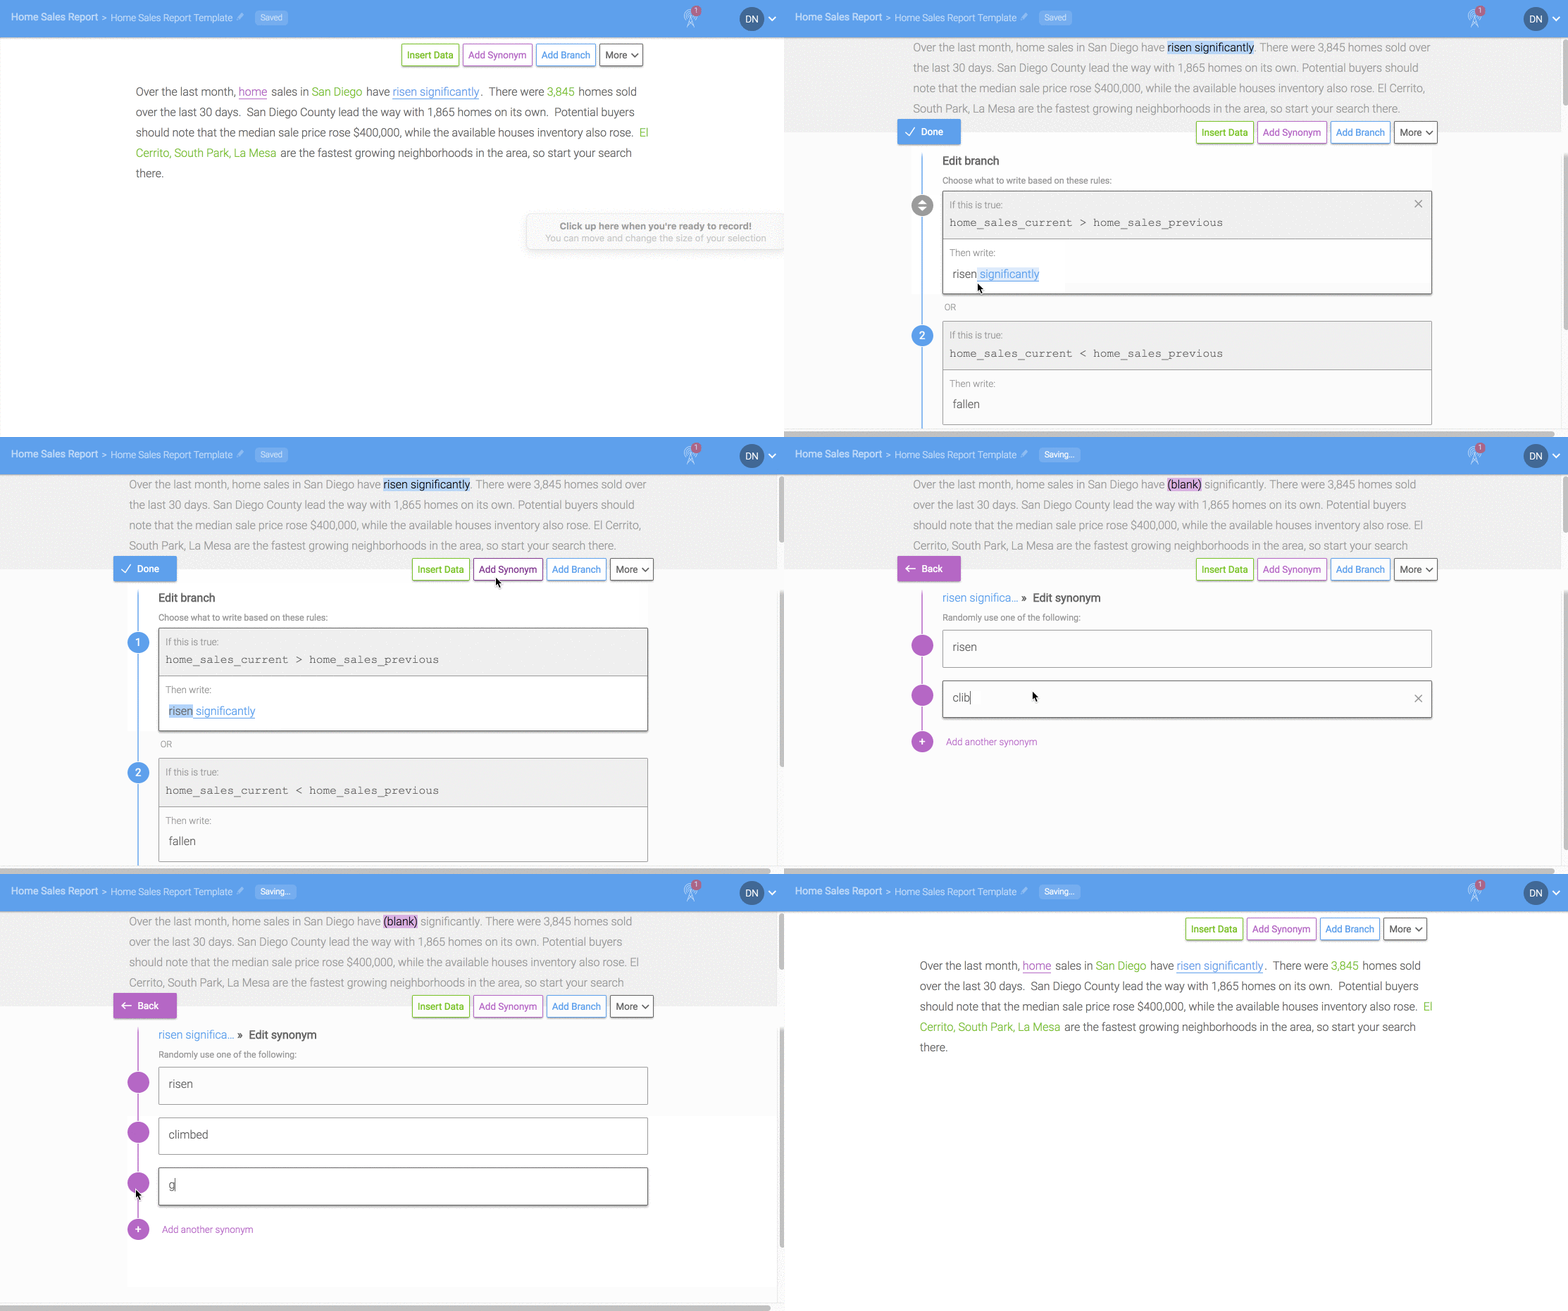
You can also add synonyms to words or phrases that are part of branches. In the branch pane, highlight the text you'd like to add options for, and click the "Add Synonym" button. Then enter in synonymous words or phrases by using the purple plus key.
PRO TIP
Combine branch logic and variability to make text that's relevant and unique. Create a branch for a paragraph or your whole narrative. Set up rules to start your content with whatever is most significant.
For example, if the number of homes sold has increased or decreased significantly, then start your narrative with a with a sentence about homes sold. And if home sales haven't changed much, but the median price of a home has skyrocketed, start your narrative with a sentence about the median sales price.
STEP 6: Add branches to change the text for different scenarios
Where synonyms change what's written randomly, Branches will change what's written based on rules. Branches are “if-then” statements that are your way to tell Wordsmith “write this word or phrase, but only under certain conditions. Otherwise, write a different word or phrase.”
Branches ensure that your text adapts to the changing conditions in your data. For example, our sample narrative always says that sales in the region have risen — but we need to account for cases in which they fell or stayed flat.
To fix this, highlight a word (or multiple words) and click the "Add Branch" button.
In the first box, under the head 'If this happens,' you can type in a simple rule that is either true or false. For our homes example, we use the condition “sales > sales_previous.” To enter this condition, start typing the data point you want to reference. You'll see a helper list of all of the data points from your CSV file start populating, and the operators you can use based on if that data point is a number, text, or a list.
Under that rule, put the words, phrases, or sentences you want Wordsmith to write if that rule isTrue. You'll write that in the “Write this:” box. You can even insert data in the box, just like in the main Editor.
In our simple example, it looks like this:
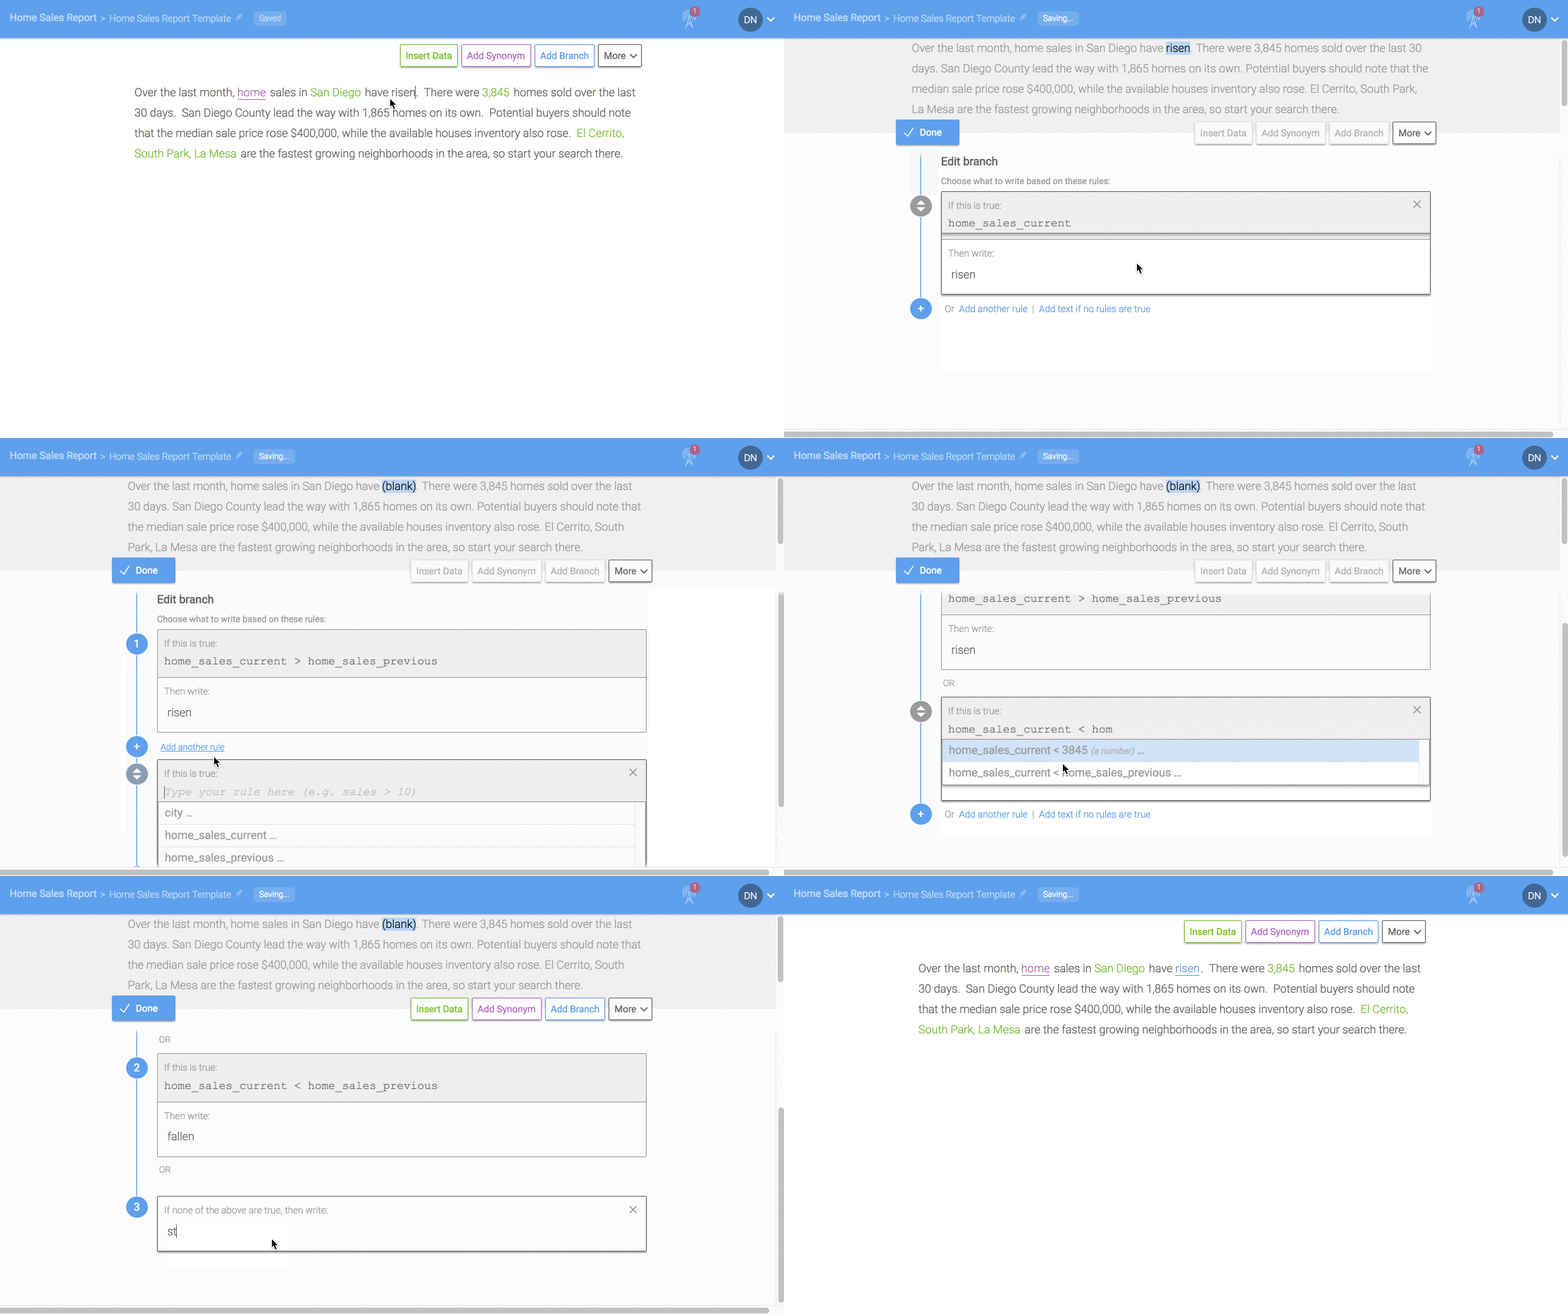
Click the "Done" button to go back to your Template. You’ll see your branch is now in blue text, indicating that it is no longer static. What's written will depend on the conditions you've set up in that branch. To open the branch pane up again, just click the blue underlined text.
You can do a lot with the “If this happens:” box. For example, you could trigger phrases in cases where data values are greater than specific numbers.

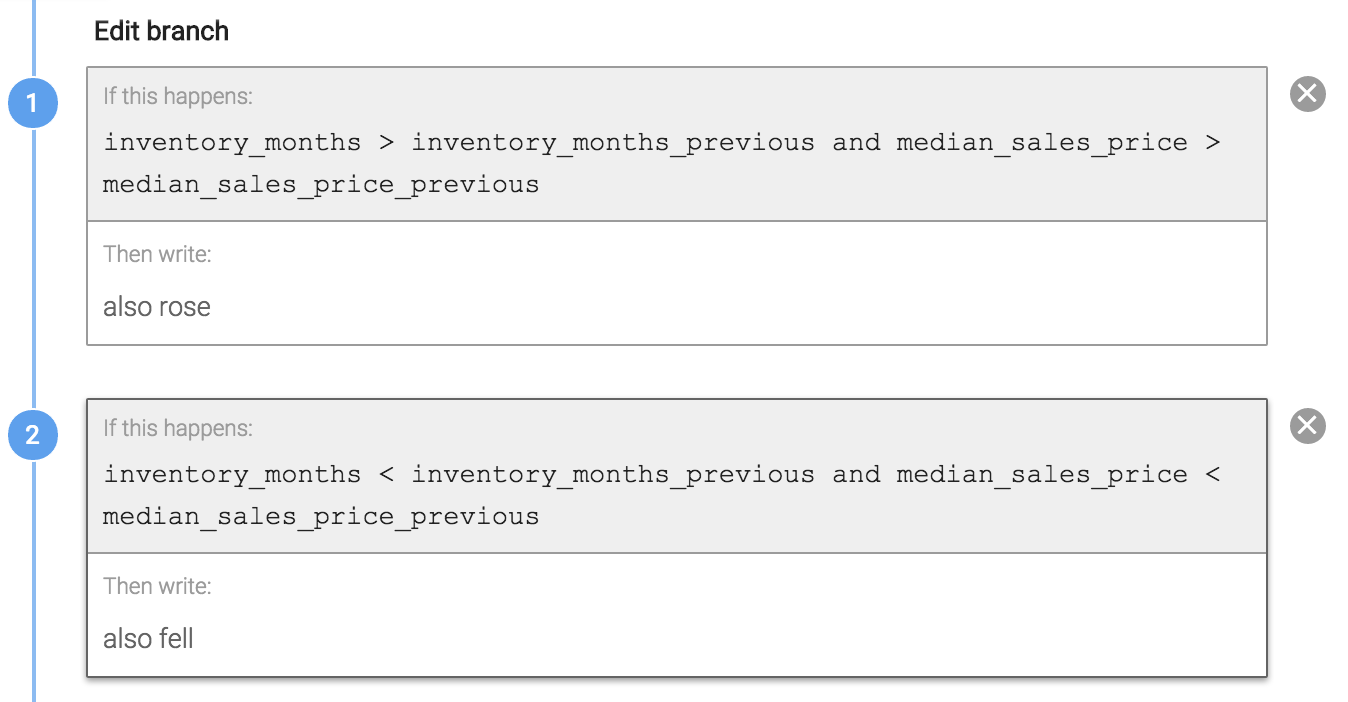
You can also group inequalities together using “and” and “or”, creating text that will trigger in the case on multiple conditions.
The example below is a little hard to read because the variable names are so long, but it’s telling Wordsmith to write the phrase “also rose” if both this month’s median sales price and sales numbers are higher than their previous month’s numbers.
Finally, you can add in options for when none of the rules are true, like a catch-all phrase. Whatever you write in that box will be written if none of the other rules are true.
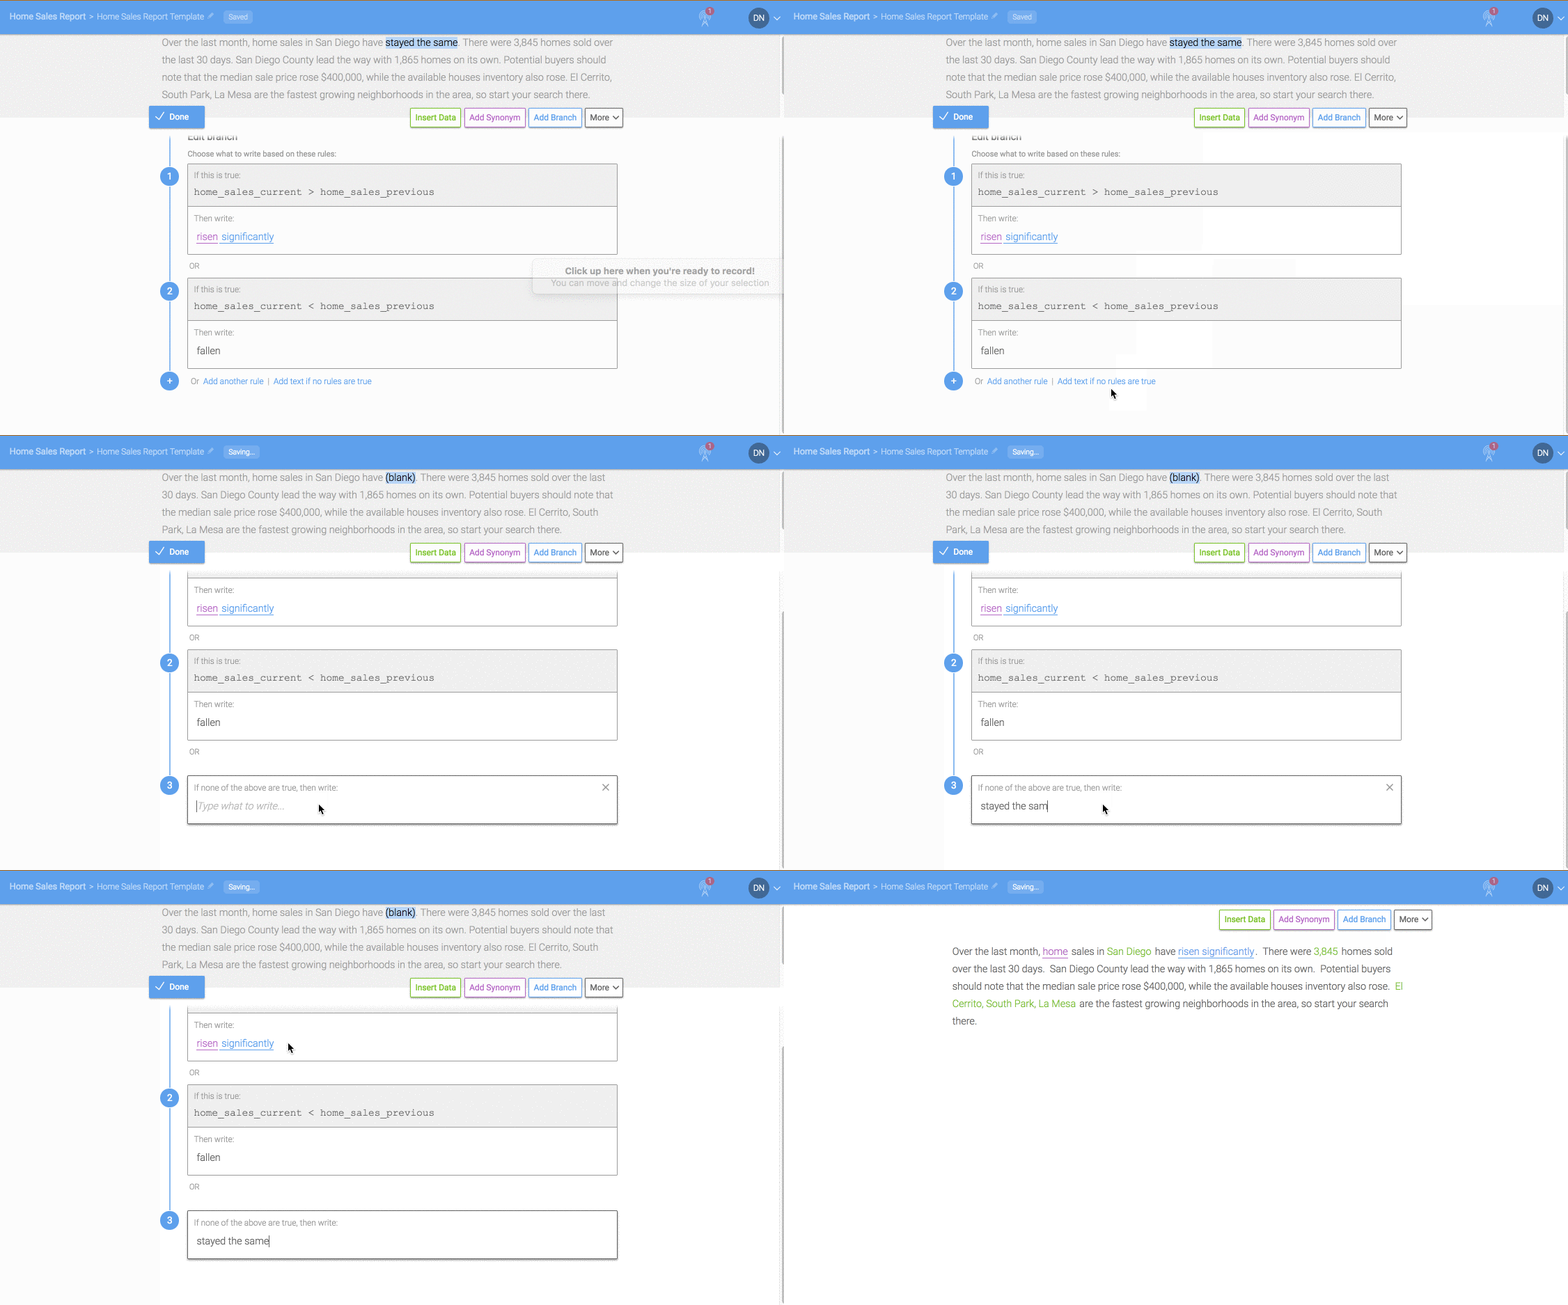
PRO TIP
Wordsmith checks each branch rule from top to bottom, “waterfall” style.
If the first rule is true, then Wordsmith stops and writes what is in that box. If the first rule is not true, Wordsmith moves on to the next one. Because rules are evaluated from the top down, organize your branch so that the most rare rules are at the top. That way, they will be evaluated first, and your rules can get more general further down the branch.
You can also use the waterfall method to generate phrases that are specific to a certain data range. For example, say your first branch is for x > 5 and your second branch is for x > 2. If the x > 2 condition applies, you will also know that x <= 5. If x > 5, Wordsmith would never have gone down to the second rule.
Wordsmith also allows you to add branches inside branches. These nested branches give you even finer control over your narrative. To create a bub-Branch, click one of your branches to open it in the branch Editor, highlight some text in one of your “Then write…” boxes, and click “Add Branch.” It works similarly to how you create branches in the main Editor.
In the example below, the sub-branch will add the phrase “and have surpassed the triple digits” when last month’s sales were less than 1,000 but this month’s sales are 1,000 or more.
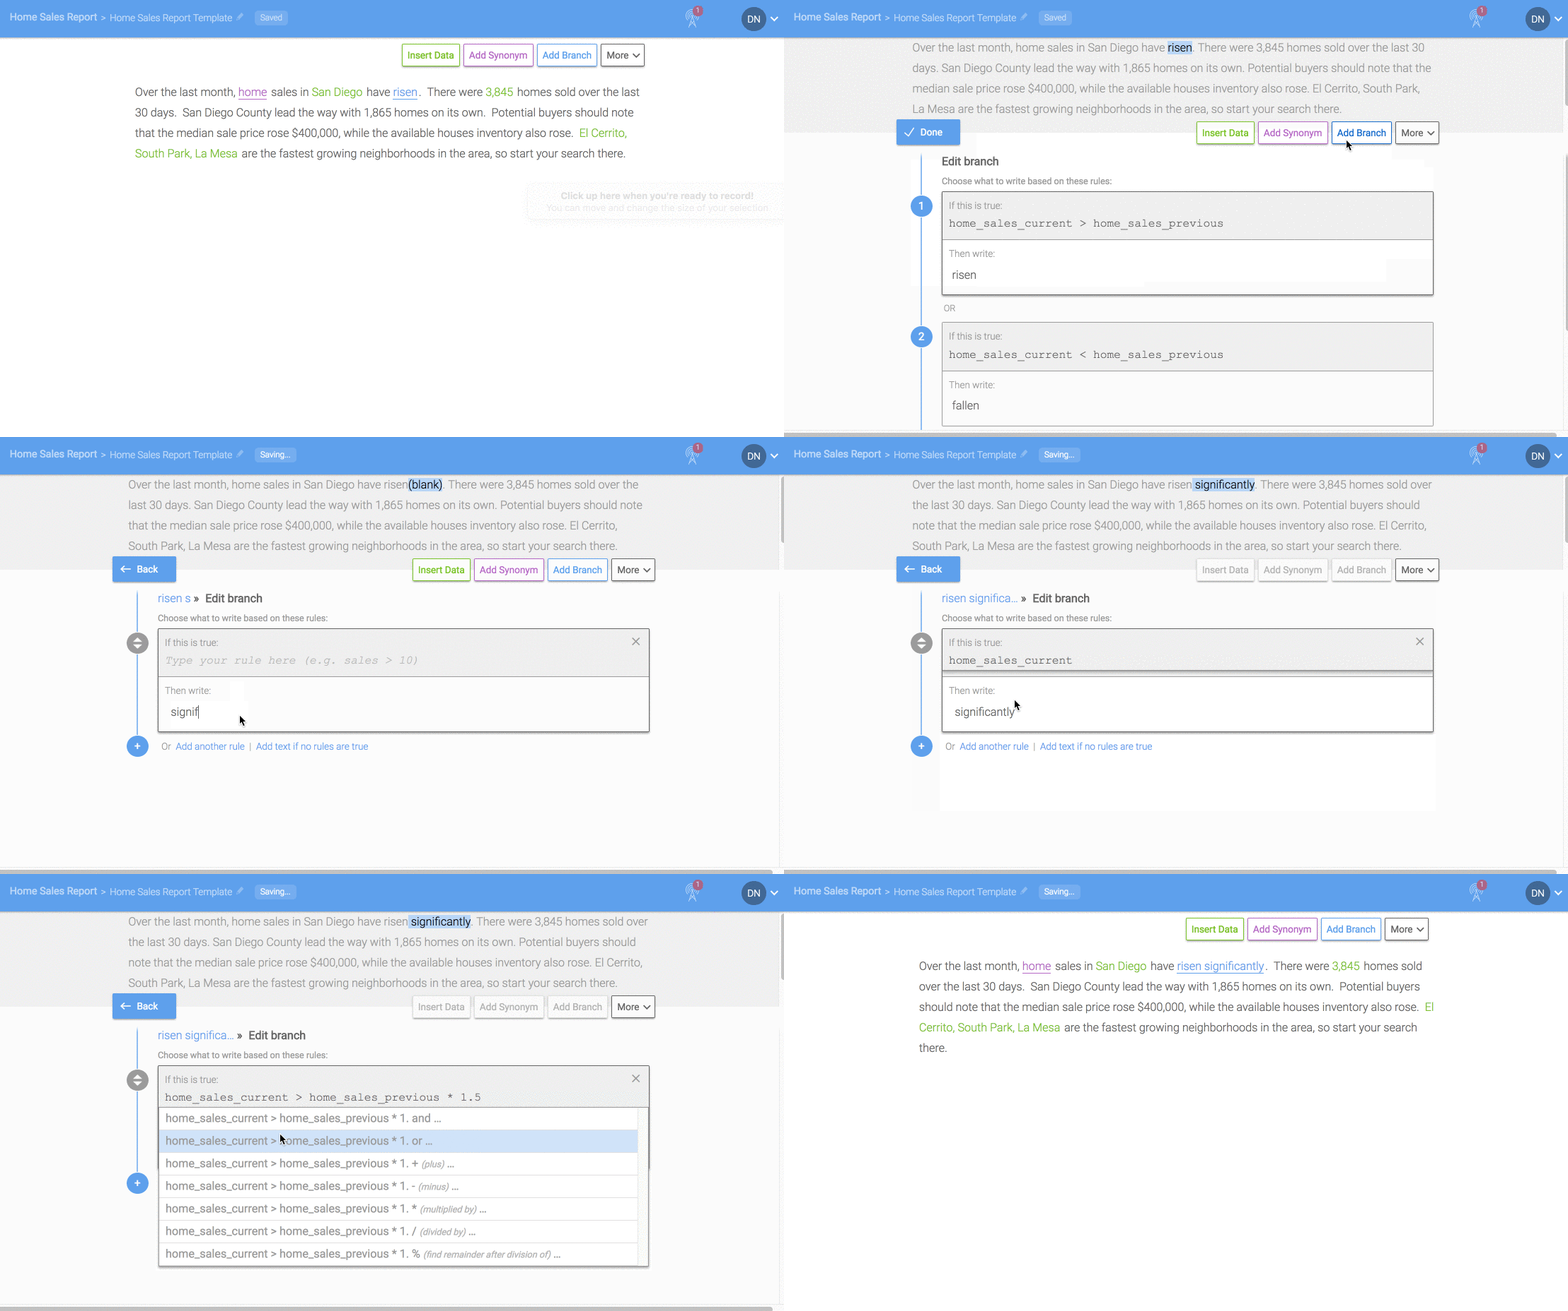
The sub-branch interface is just like the branch interface - and you can even add sub-branches within sub-branches. You can get back to the parent branch by clicking the “Back” button in the upper left corner of the branch Editor.
Don’t worry - you don’t need any sub-branches to create compelling narratives. They’re an advanced feature if you want further variability and control.
For an in-depth guide on advanced branches, check out this article.
STEP 7: Preview your narratives
Once you add all of your data, branches, and synonyms, your Template will look something like this:

Click the "Test" link in the upper right corner to preview your narratives. On the Test page, Wordsmith uses the first 50 rows in your dataset to create a unique narrative for each and you can scroll through them.
You'll notice the Summary at the top of the Test page. This will give you a few quick metrics about the text you've created, like the average number of words, maximum and minimum word count, and reading time.
Something to note here is that Wordsmith has only analyzed the 50 narratives on the Test page. So if you have thousands of rows of data, these metrics will measure the narratives generated from the first 50 rows of data.

Readability is the ease with which a reader will understand the text. A lower score indicates text that will be understandable to a larger audience. If you use a lot of proper nouns, technical language, or jargon, the text may be scored harder to read than it actually is for readers knowledgeable in your field.
Variability is a measure of how much your text changes across all of the content on the Test page. Low variability is suitable for business reports where consistency is helpful. Medium variability works for most types of content. High variability is good when users will read several articles and you want to limit repetition. It's also ideal for SEO.
It’s usually a good idea to check through several narratives to make sure your Template was set up correctly. You may notice data or grammar issues you need to fix, or you want to add more variability. To get back to the Template to make changes, click "Write" in the upper right corner.
STEP 8: Export your narratives
Now that your Template is working the way you want, you can download narratives for all the rows in your dataset. To do that, click the "Download" link next to "Test" in the top right corner of the page.
There are 3 steps to downloading your content:
- Click the "Start Generating" button. Once all of your narratives have generated successfully (meaning there were no errors and every narrative is complete), you'll be prompted to go to step 2.
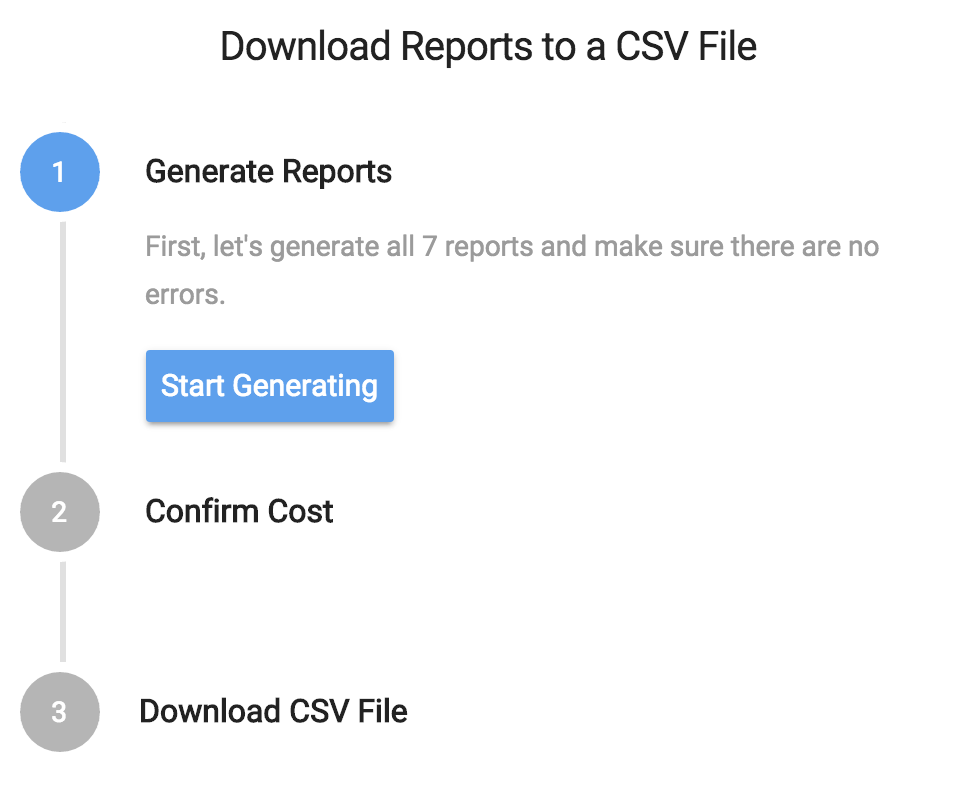
- Confirm that you are ready to be billed for the content you have generated based on your Wordsmith subscription.
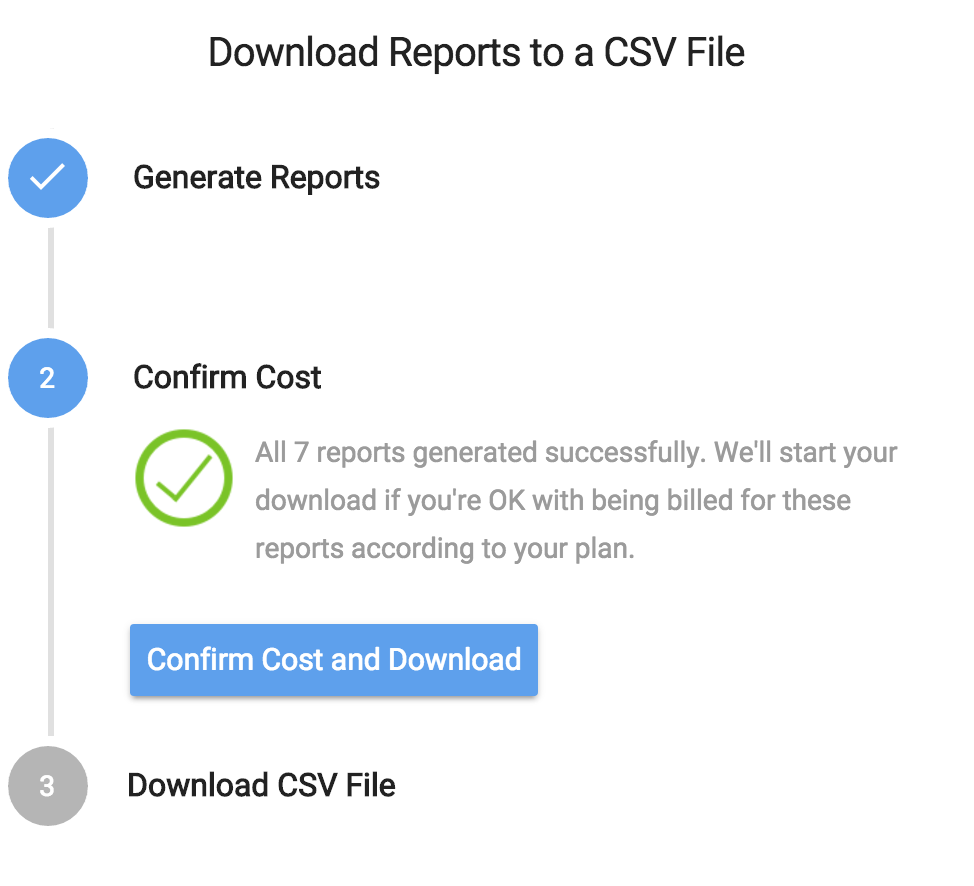
- Download your narratives as a CSV file. Every narrative will be on its own row. This is a useful format for developers who want to insert the text into other applications.

Another way to create narratives is to use our API. You or your developers can take a look at our API documentation here to see how it could work for you.
Updated about 6 years ago
